Small Variant Grid
This page provides the ability to:
- Sort variants by Tier or Exomiser score
- Review the germline small variants identified by the Genomics England Rare Disease Pipeline (DRAGEN)
- Review additional annotations and linkouts to external resources for each variant (see SNV grid guide below for further details)
- Assign an ACGS/ACMG classification to a variant, including selecting a transcript, contribution to phenotype, and adding a comment (see the recording interpretation page)
- Exclude a variant, with reasoning and comment (see the recording interpretation page)
- See a history log of interpretation actions
N.B The New IB supports cases with SNVs that were processed since release 4.0, CNVs that were processed since release 4.2, and cases with Tiered STRs that were processed since release 4.3. Any cases that do not fit these criteria are not supported by the product, therefore it will not be possible to analyse them in the New IB, and alternative existing systems should be utilised to analyse the case.
SNV grid guide
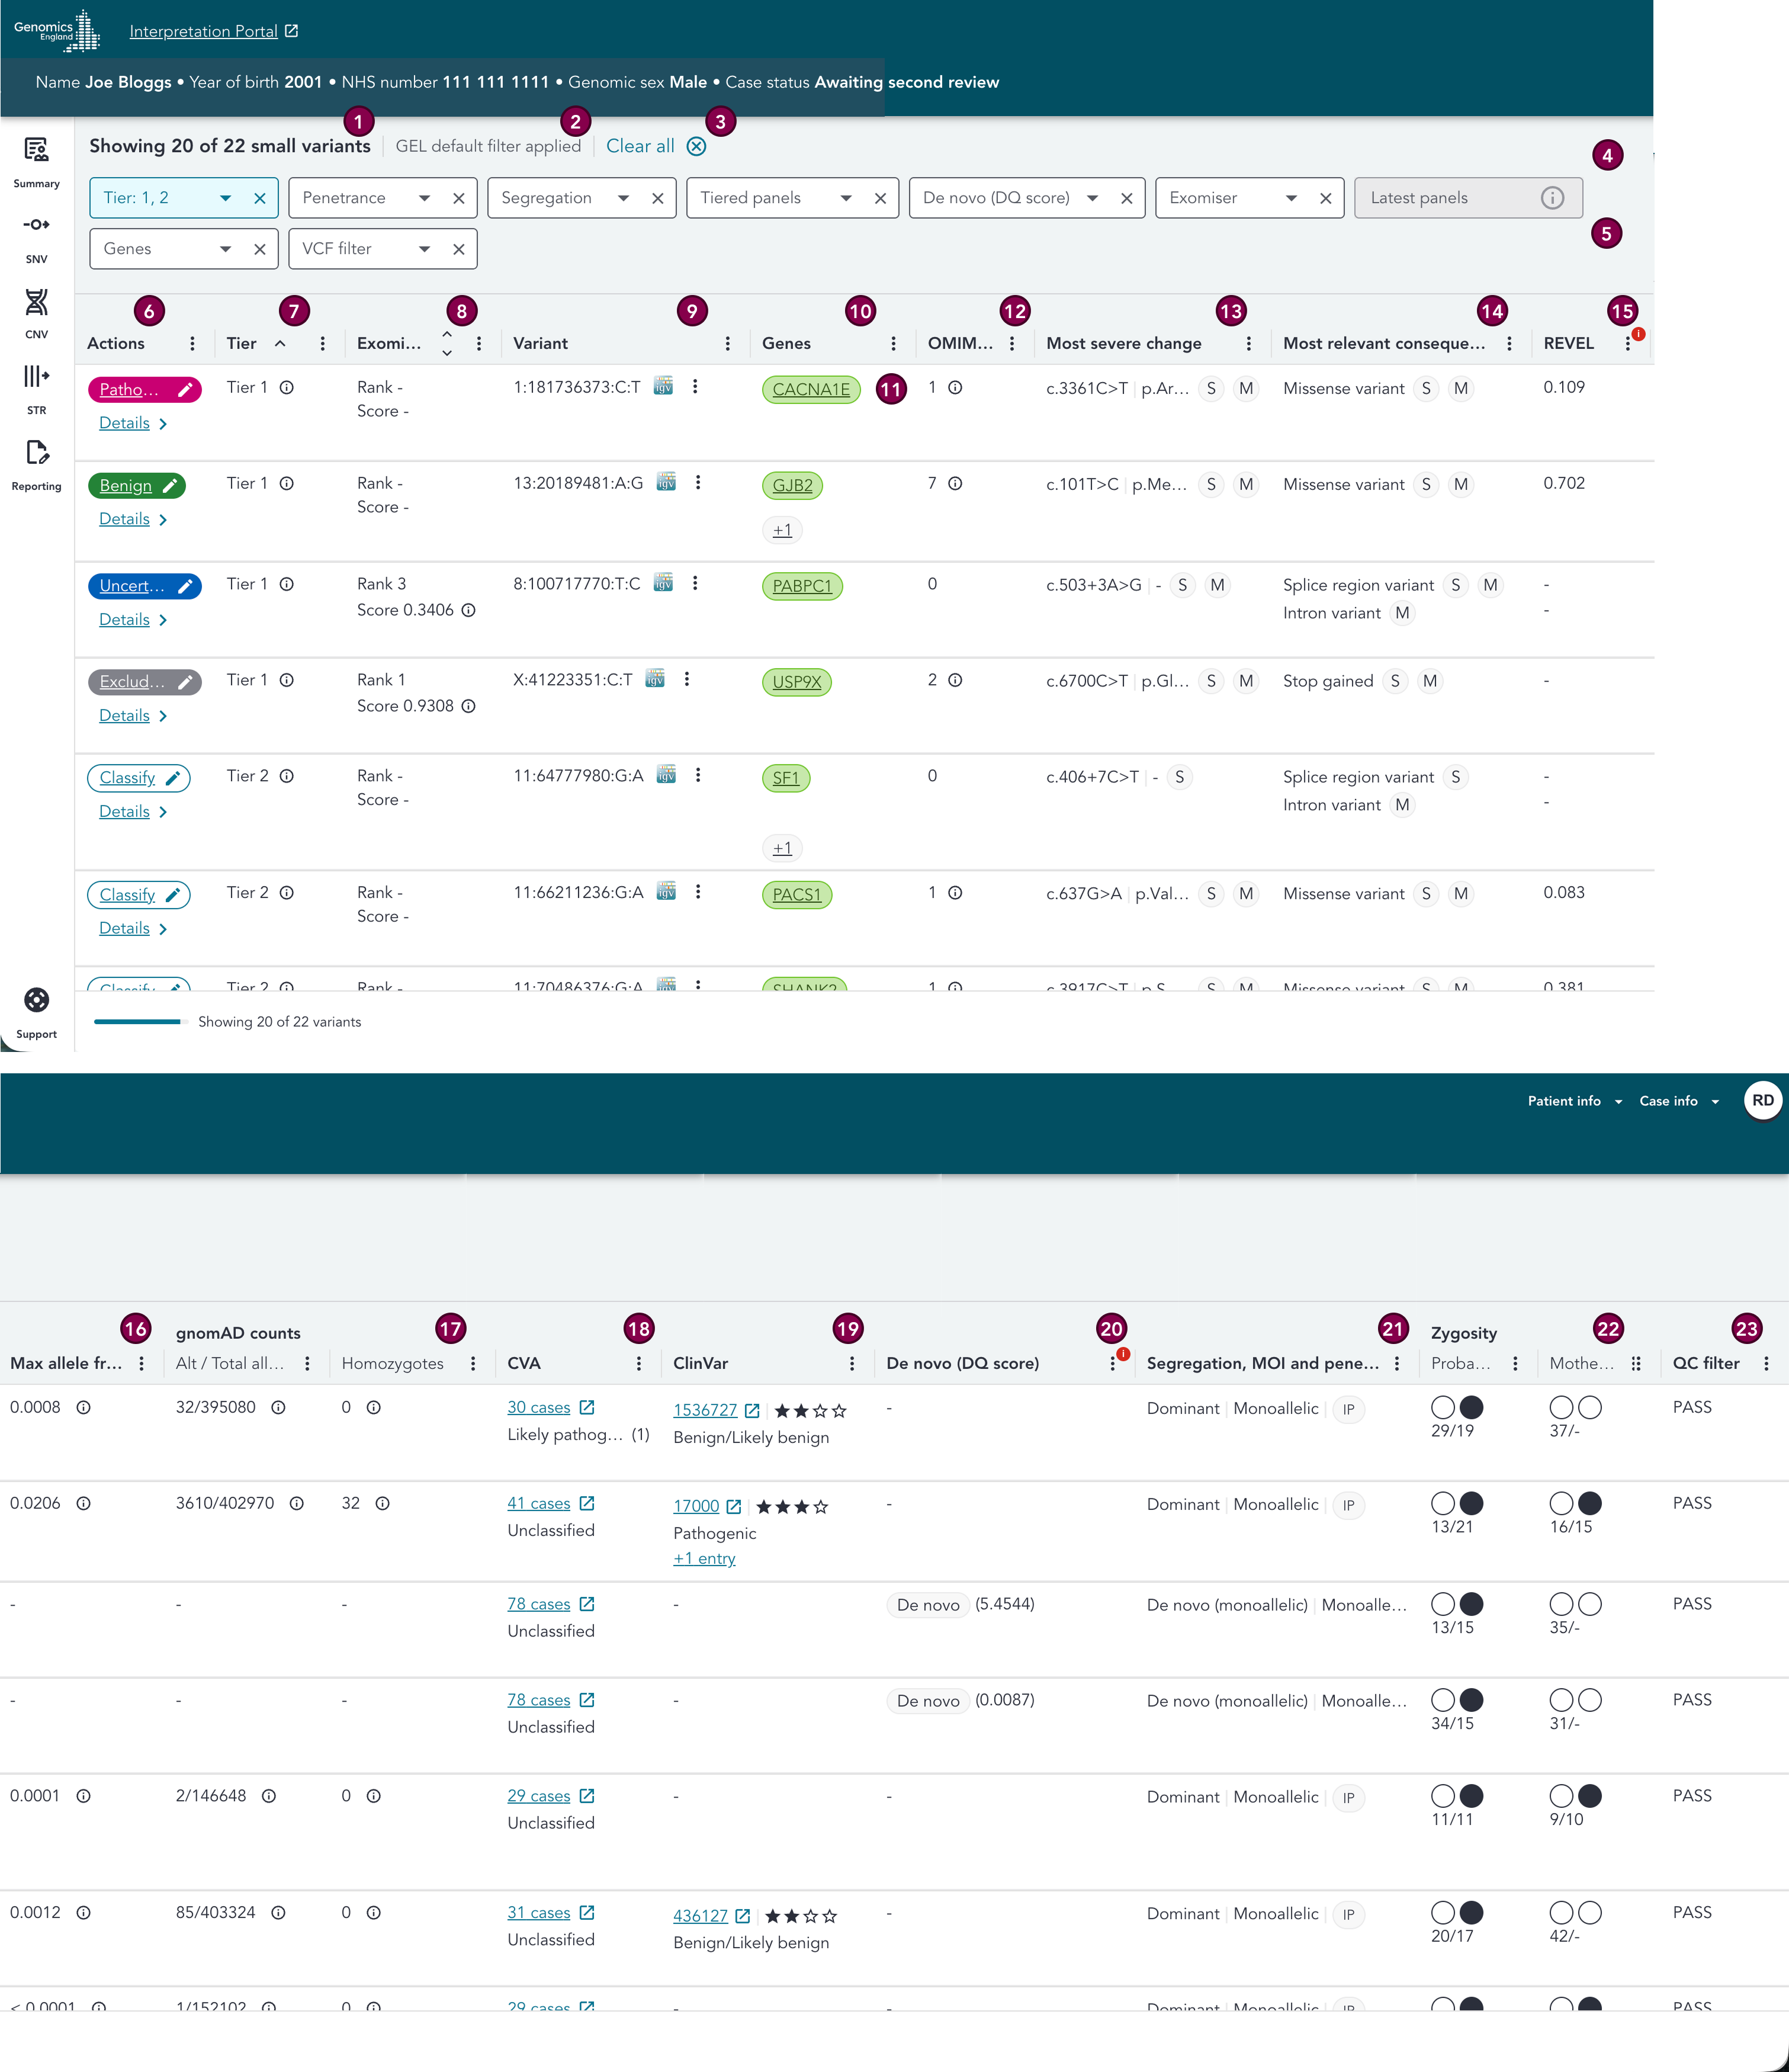
The order of columns in the SNV grid can be changed using the column headers. This will persist when you navigate around the case, so you can click onto a different page and come back to the SNV grid and your column order will remain intact. Please note however, that should you refresh the page, open the case in a new tab, or log out (/be logged out of) the system then log back in again and reopen the same case, then the column order will reset back to the default.
20 variants are shown by default, and more are loaded dynamically when scrolling to the bottom of the page.
Please use the below key in conjunction with the below sections to learn more about the columns in the variant grid.
Key
| # | Section | Description |
|---|---|---|
| 1 | Variant count | Summarises the number of variants currently displayed in the grid, and the total number of variants matching the selected filters. |
| 2 | Filter status | Denotes whether filters have been applied or there were no filters applied at all. GEL default filter applied indicates that the default set of filters is active, Custom filters applied indicates that an alternative combination of filters is active, No filters applied denotes that no filters are active. |
| 3 | Clear all | Click to remove all applied filters, including the GEL defaults. After clearing, filters can be reset to default using the Reset to default button. |
| 4 | Filters | Filter drop-downs can be used to apply various filters to the variant list: VCF filter, Tier, Segregation, Penetrance, Exomiser, De novo (DQ score), genes. GEL default filters are automatically applied. See the Filters section below below for further details. |
| 5 | Incompatible filters | Some combinations of filters are incompatible due to the differing sources of the data meaning that it would be misleading to allow them to be used in combination. For further details, see the Filters combinations section below below for further details. |
| 6 | Actions | A Classify button which can be clicked to open the classification drawer, and changes to display the classification of the variant once it has been assigned (for further details see the recording interpretation page). Once the classification is selected for the variant, it is displayed in place of the Classify button. A Details button which navigates to the variant details page for the variant. |
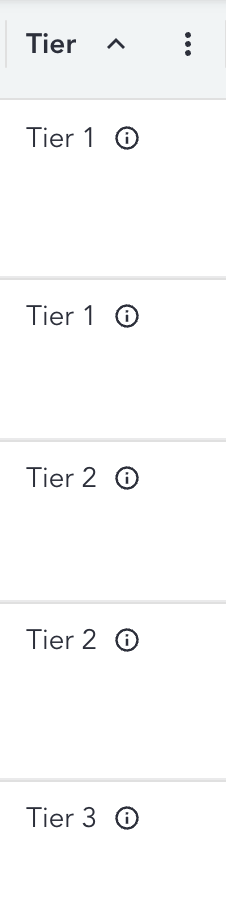
| 7 | Tier | This can be Tier 1, Tier 2, Tier 3, or "-" for untiered variants or variants that do not fall within a gene. For further details, please visit the Tier section below. |
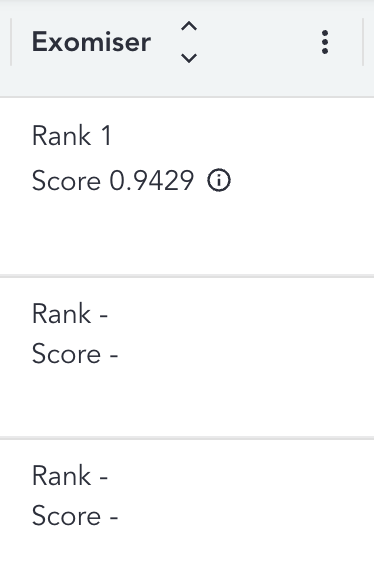
| 8 | Exomiser | The highest Exomiser rank and corresponding score for the variant are displayed in the column. For further details, please visit the Exomiser section below. |
| 9 | Variant | The VCF format of the variants, with a button that can be used to link-out to IGV (for read depth investigation). There is also a button that opens a menu containing further links to external databases and resources (DECIPHER, gnomAD, UCSC, VarSome and SpliceAI) for the variant, and a button to copy the variant coordinates in Alamut format. |
| 10 | Genes | HGNC gene symbol(s) which the variant affects. For further details, please visit the genes section below. |
| 11 | Gene colour | Genes in Tiered variants are coloured green according to their PanelApp green gene status. For further details, please visit the genes section below. |
| 12 | OMIM associated diseases | Count of associated diseases for the gene in OMIM. For further details, please visit the OMIM section below. |
| 13 | Most severe change | The c. and p. HGVS nomenclature for the transcripts for the gene visible in the row that are any of: 1. The most severe change across the annotated transcripts for that gene (indicated by the (S) flag), 2. A MANE Select or MANE Plus Clinical transcript (indicated by (M and/or M+)). For further details, please visit the most severe change section below. |
| 14 | Most relevant consequences | Predicted consequence types (SO terms) for the gene that is visible in the row, which are the most severe across all annotated transcripts for that gene, plus we also display any consequences for MANE Select and MANE Plus Clinical transcripts annotated for that gene. For further details, please visit the most relevant consequences section below. |
| 15 | REVEL | Displays the highest available REVEL score for each displayed missense consequence and gene, with higher scores indicating a greater predicted likelihood of pathogenicity. Transcript-level scores should be reviewed before applying ACMG/AMP criteria. A dash is shown for non-missense consequences or where no REVEL score is available. Where the case was ingested prior to REVEL annotations being available, warning icons are displayed in this column. For further details, please visit the REVEL section below. |
| 16 | Max allele frequency | Maximum allele frequency for the variant across gnomAD and Genomics England internal studies. Clicking on the tooltip reveals the source population and sub-population. |
| 17 | gnomAD counts (Alt/Total alleles | Homozygotes) | Displays, for the variant, across gnomAD studies within which we see the variant, the total number of alt alleles (number of times the variant is observed), the total number of alleles, and the number of homozygous genotypes (number of individuals that are homozygous for the variant). It is currently not possible to display this data for mitochondrial variants, therefore population frequency data for these variants must be reviewed in the variant details page. Clicking on the tooltip reveals the source populations for the totals. N.B. the column displays gnomAD totals only as the number of alt alleles is not available for the Genomics England dataset. |
| 18 | CVA | Displays any CVA classifications for the variant. The number of cases the variant has been seen in is displayed, with a link-out to the CVA page for the variant, plus the number of previous classifications per classification type, or Unclassified if there have been no previous classifications. This data is live when viewing the case. If the variant is not in CVA, then a '-' is visible. If there is an error with loading the data then a red i icon will be displayed. All cases, regardless of whether they were analysed in the New IB or other existing products, are sent to CVA. |
| 19 | ClinVar | ClinVar accession number, review status and link-out to the ClinVar entry are displayed here. If there is more than one accession number for the variant, the accession with the most submissions is displayed first (and if equal then the most pathogenic will be displayed first). Further entries will be denoted by the +X entries indicator, which can be clicked to view a ClinVar overlay. For further details, please visit the ClinVar section below. |
| 20 | De novo (DQ score) | Displays the DQ score for eligible SNVs and indels, indicating confidence that a variant is genuinely de novo. Variants meeting the applicable pipeline threshold are labelled De novo, while others display the score without the label. The relevant threshold is visible on hover. For further details, please visit the De novo section below. |
| 21 | Segregation, MOI, penetrance | Displays the segregation, mode of inheritance, and penetrance groupings for Tiering prioritisation results for the variant (N.B. groupings from Exomiser are not visible, nor are they visible for untiered variants). If there are multiple groups of these, they will be displayed one above the other (CP = complete penetrance, IP = incomplete penetrance). If there are 3 or more groups, only the first is displayed and a link is provided displaying the number of additional groups. When the link is clicked, the Tier overlay opens. |
| 22 | Zygosity (Proband / Mother / Father etc.) | A column for the proband and one per family member, containing the zygosity symbols, and ref/alt read split information. Affected status is indicated for each individual in the column header. More details can be found in the segregation card on the Variant Details page for the variant. On hover over the zygosity symbols, the affected status of the individual is displayed (X Affected, X Unaffected or X Uncertain). |
| 23 | QC filter | Indicates whether the variant passed QC filters applied during the analysis. Obtained from the VCF file. |
Sorting
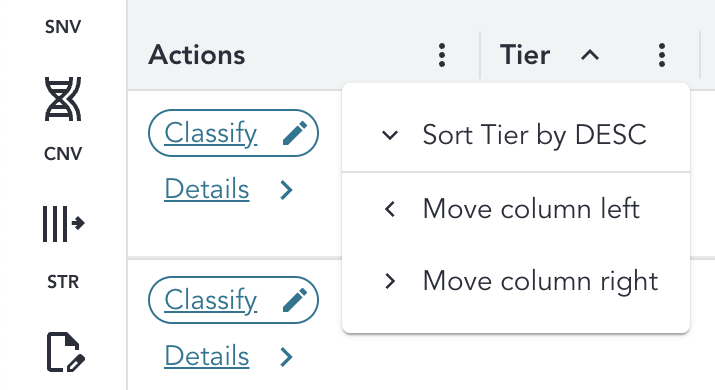
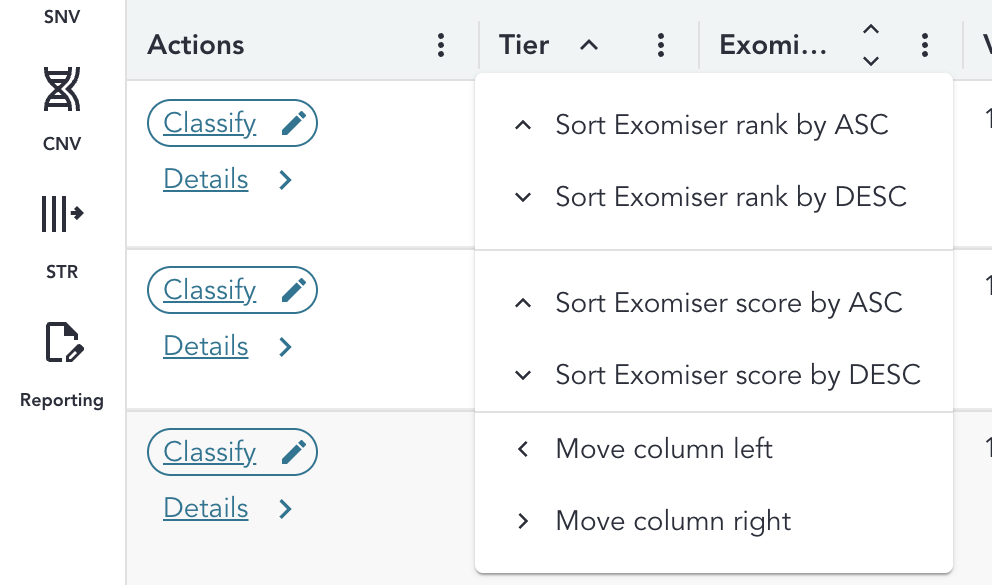
By default, all variants are sorted by Tier ascending and by variant coordinates. Variants can be sorted by Tier, Exomiser rank or Exomiser score ascending or descending by using the arrow icon or menu in the column headers.
Please note, sorting by Tier and Exomiser columns are independent of one another - if you apply a sort on one after sorting on the other, a combination sort will not apply - the sort will simply be overruled.
Filters
Filters can be used to narrow the variants displayed in the variant grid to variants of interest with specific selected attributes. The filters are located above the grid column headers. For further details on specific filters, please view the tabs below. Please also ensure you have reviewed the section on Filter combinations, and understood the caveats and behaviours of the filters when used in combination, plus the incompatible filter combinations and reasoning for those. When you apply filters, please review the annotations in the grid to ensure that you have understood why the variant meets your filter criteria.
The number of variants returned by the filters, and number of variants currently visible in the grid, is highlighted by the counts above the applied filters.
Applied filters will persist when you navigate around the case, so you can click onto a different page and come back to the SNV grid and the same filters will still be applied. Please note however, that should you refresh the page, open the case in a new tab, or log out (/be logged out of) the system then log back in again and reopen the same case, then the applied filters order will reset back to the GEL default filters.
N.B. Application of filters does not perform any re-Tiering of variants in the case
GEL default filters
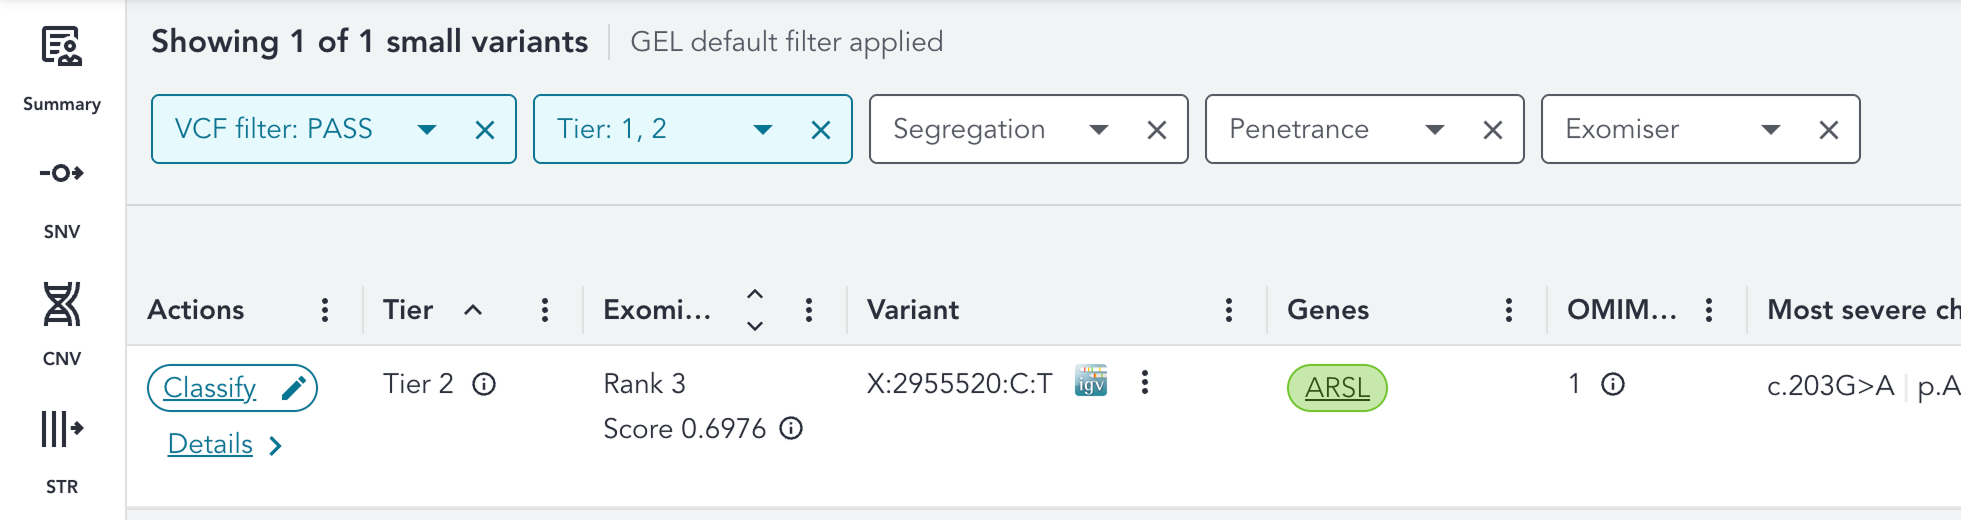
A pre-set combination of filters, GEL default filters, are applied to the SNV grid by default in order to restrict the visible variants to those that are of interest for interpretation, and reduce noise. The set of default filters are as follows:
- Tier: Tier 1, Tier 2
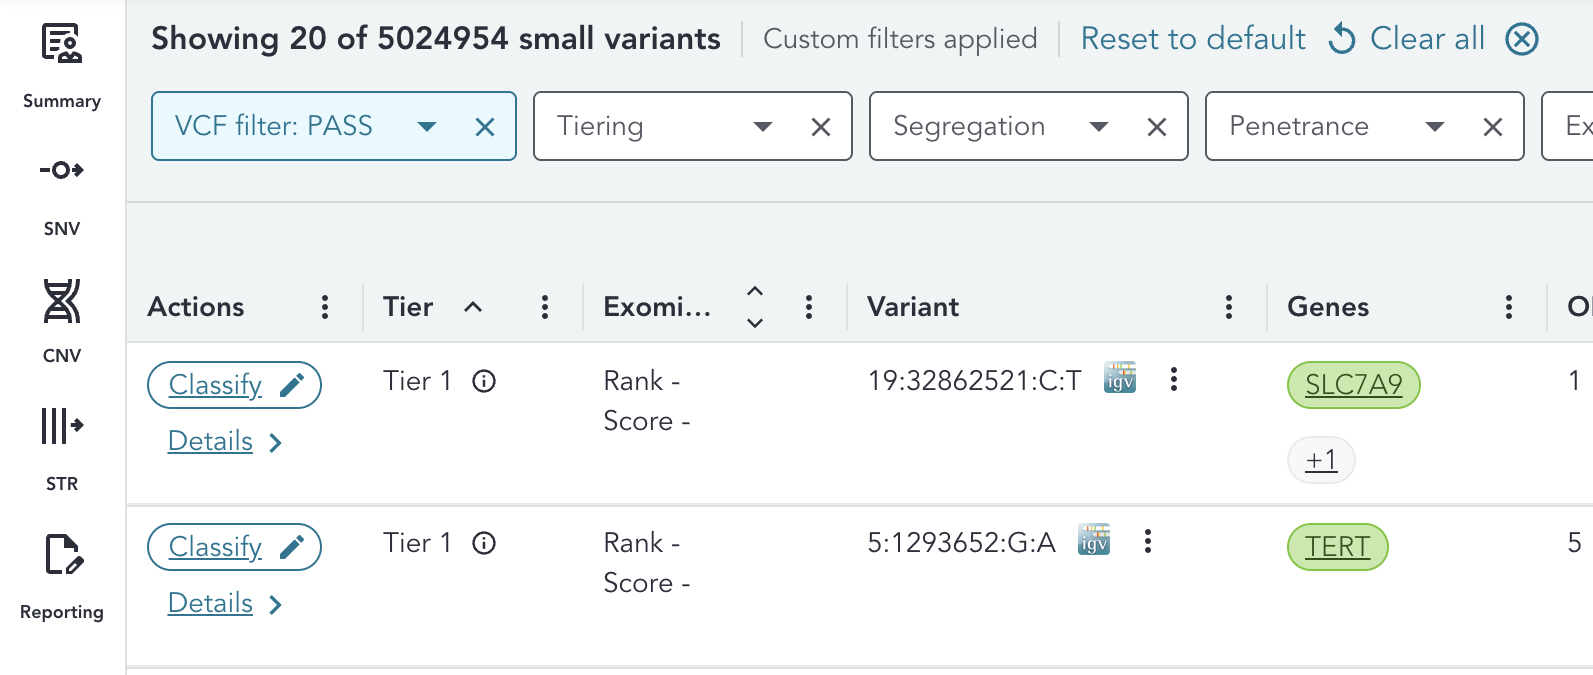
When GEL default filters are active, GEL default filter applied is visible at the top of the grid. Additional filters can then be selected, or one or multiple of the GEL default filters deselected. Custom filters applied will then be visible at the top of the grid.
If the GEL default filters or custom filters return no variants, this is clearly indicated by a message within the grid.
Removing filters
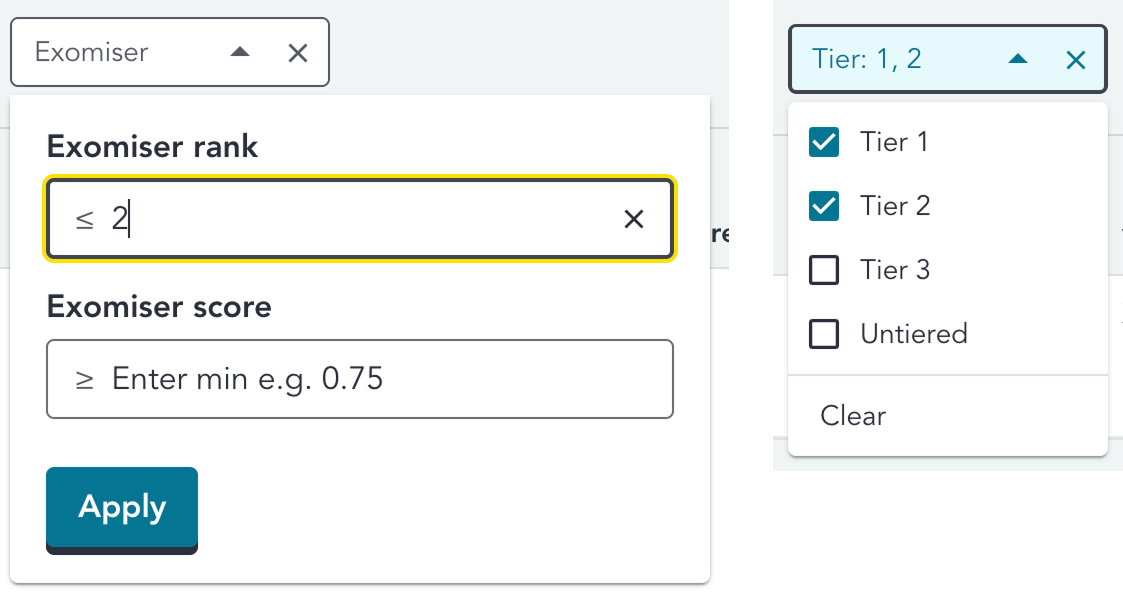
Filters can be removed easily by:
- Deselecting the filter selection or clicking clear within the multi-select drop-downs
- Clearing the text box manually, or clicking the cross, within the Exomiser drop-down
- Clicking the Reset to default button if custom filters have been applied, which reverts the filters back to the GEL default filters
- Clicking the Clear all button if any filters are applied, which removes all applied filters including any GEL defaults
If all filters have been removed, No filters applied will be visible at the top of the grid.
Tier filter
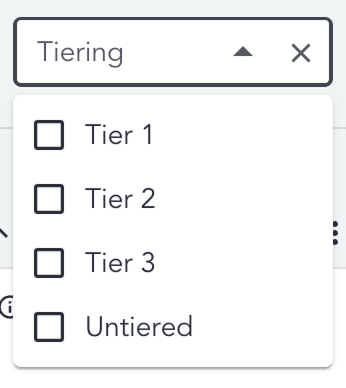
Variants can be filtered based on their Tier as assigned by the Genomics England Rare Disease Pipeline. There are 4 selection options (see below). This filter works at the Tiering prioritisation result (previously known as Report Event) level, so if a variant has any Tiering prioritisation result that match that Tier, then the variant will be displayed within the filter results. If multiple are selected, variants will be displayed that match any selection. N.B. If Tier 3 is selected, and the variant has a Tier 3 prioritisation result but also has a higher Tiering prioritisation result (for example Tier 1), then that variant will still be displayed within the grid.
- Tier 1
- Tier 2
- Tier 3
- Untiered
Penetrance filter
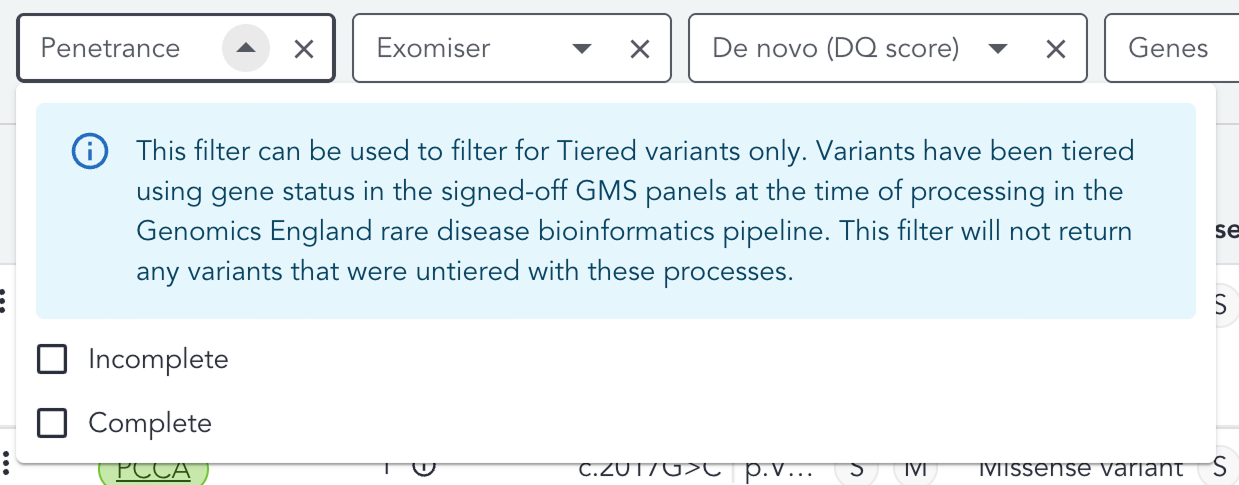
Variants can be filtered based on the penetrance mode for their Tiering prioritisation result(/s) (previously known as Report Events) as assigned by the Genomics England Rare Disease Pipeline. There are 2 selection options (see below). This filter works at the Tiering prioritisation result level, so if a variant has any Tiering prioritisation results that match that segregation, then the variant will be displayed within the filter results. If multiple are selected, variants will be displayed that match any selection. N.B. this filter is Tiering prioritisation result specific - when applied, variants with no Tiering prioritisation results will be filtered out by default
- Complete
- Incomplete
Segregation filter
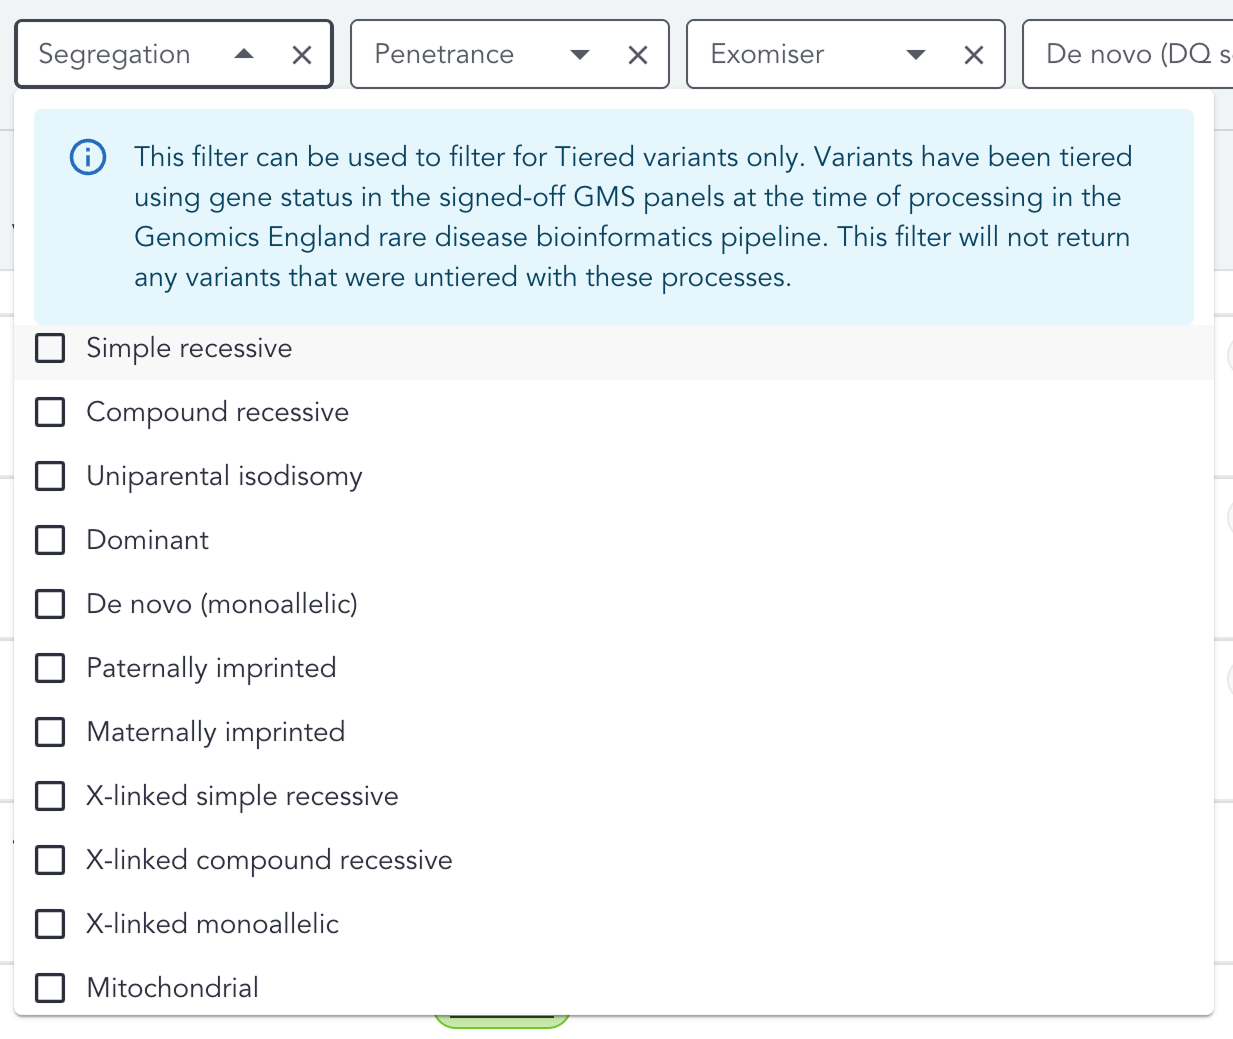
Variants can be filtered based on the segregation for their Tiering prioritisation result(/s) (previously known as Report Events), as assigned by the Genomics England Rare Disease Pipeline. There are 11 selection options (see below). This filter works at the Tiering prioritisation result, so if a variant has any Tiering prioritisation result that match that segregation, then the variant will be displayed within the filter results. If multiple are selected, variants will be displayed that match any selection. N.B. this filter is Tiering prioritisation result specific - when applied, variants with no Tiering prioritisation results will be filtered out by default
- Simple recessive
- Compound recessive
- Uniparental isodisomy
- Dominant
- De novo (monoallelic)*
- Paternally imprinted
- Maternally imprinted
- X-linked simple recessive
- X-linked compound recessive
- X-linked monoallelic
- Mitochondrial
* Please note that this segregation filter only identifies de novo variants that are consistent with monoallelic mode of inheritance. Therefore, this filter cannot be used to filter for all de novo variants in the case. In order to achieve this, please use the filter in the De novo (DQ score) column instead.
Tiered panels filter
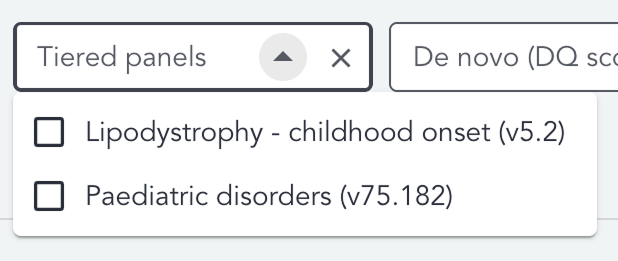
The Tiered panels filter allows you to filter for variants that were Tiered against a specific panel during the original Tiering analysis of the case by the pipeline.
The filter is populated using the panels that were applied to the case for Tiering. When one or more panels are selected, variants are returned where a Tier prioritisation result is associated with one of the selected panels.
If multiple panels are selected, the filter uses OR logic, so a variant is returned if it has a Tier prioritisation result associated with any of the selected panels.
The Tiered panels filter reflects the panels used during the original analysis and does not use the latest PanelApp panel versions.
N.B. A variant can have a Tier 3 prioritisation result where the associated gene is outside the applied panel. Therefore, a variant returned using the Tiered panels filter is not necessarily associated with a gene that is present on the selected panel.
De novo (DQ score) filter
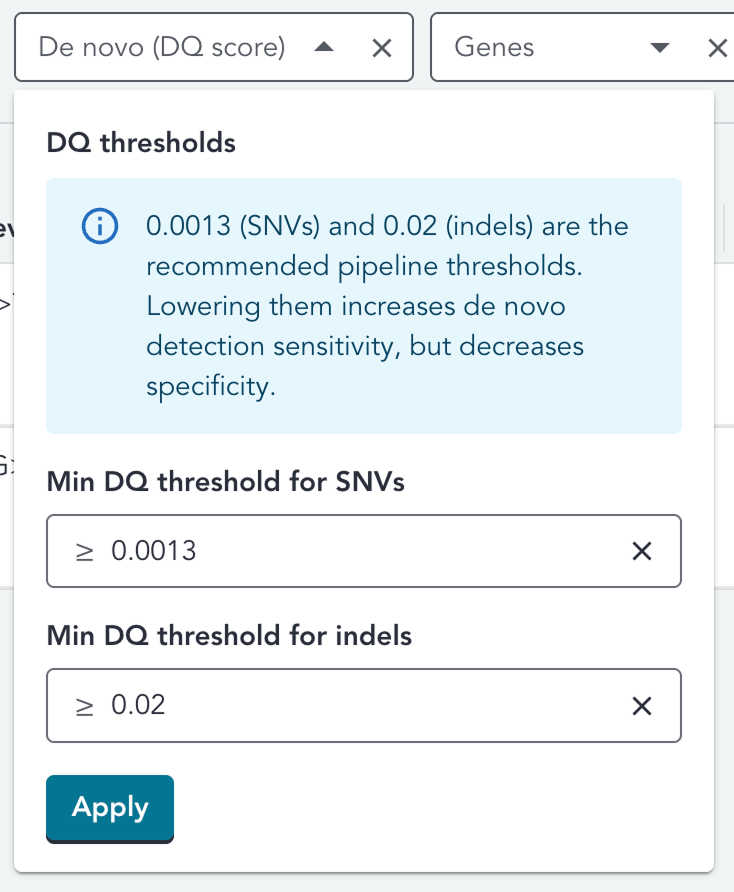
Variants can be filtered by their de novo quality (DQ) score. DQ scores are posterior probability scores calculated from the possible genotypes within the family and indicate the level of confidence that a variant represents a genuine de novo event. Higher scores indicate greater confidence in the supporting evidence.
The rare disease bioinformatics pipeline uses the following recommended DQ thresholds:
- SNVs: ≥0.0013
- Indels: ≥0.02
These values are populated in the filter by default. You can apply the default thresholds or enter custom values for SNVs and indels. Lowering a threshold increases sensitivity for detecting potential de novo variants, but will also reduce specificity and may return more false-positive results.
Only variants with a DQ score equal to or greater than the applicable threshold are returned. Variants without an available DQ score are excluded from the results.
Changing the filter thresholds does not affect the De novo labels displayed in the De novo column. These labels are fixed and are assigned according to whether the variant meets the pipeline threshold, rather than the custom value entered in the filter.
For further information, see the de novo variant detection page in the Rare Disease Genome Analysis Guide.
_N.B. DQ scores should be interpreted alongside segregation information and other clinical evidence.
Exomiser filter
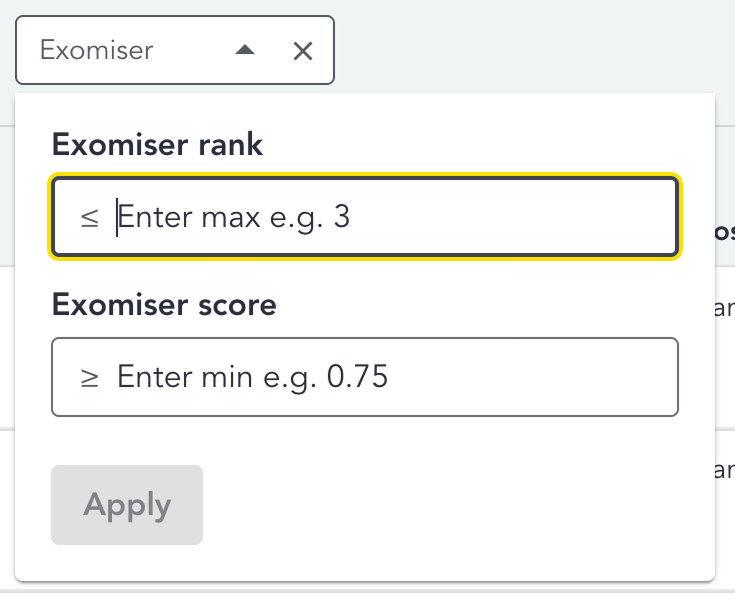
Variants can be filtered based on their Exomiser prioritisation result (previously known as Report Events) ranks and scores. There are 2 selection options (see below). This filter works at the Exomiser prioritisation result level. If one input is applied, any variants with Exomiser prioritisation result(/s) that match that condition are returned. If multiple are applied, variants that match both conditions within the same prioritisation result(/s) are returned.
| # | Filter | Description |
|---|---|---|
| 1 | Exomiser rank ≤ X | Minimum input value is 1, and there is no maximum value - i.e. any value can be input that is 1 or above. If an input doesn't match these criteria, an error message will be displayed: Value must be greater than 0 |
| 2 | Exomiser score ≥ Y | Minimum input value is 0, and maximum is 1. Inputs can have decimals. If an input doesn't match these criteria, an error message will be displayed: Value must be between 0 and 1 (inclusive) |
Latest panels filter
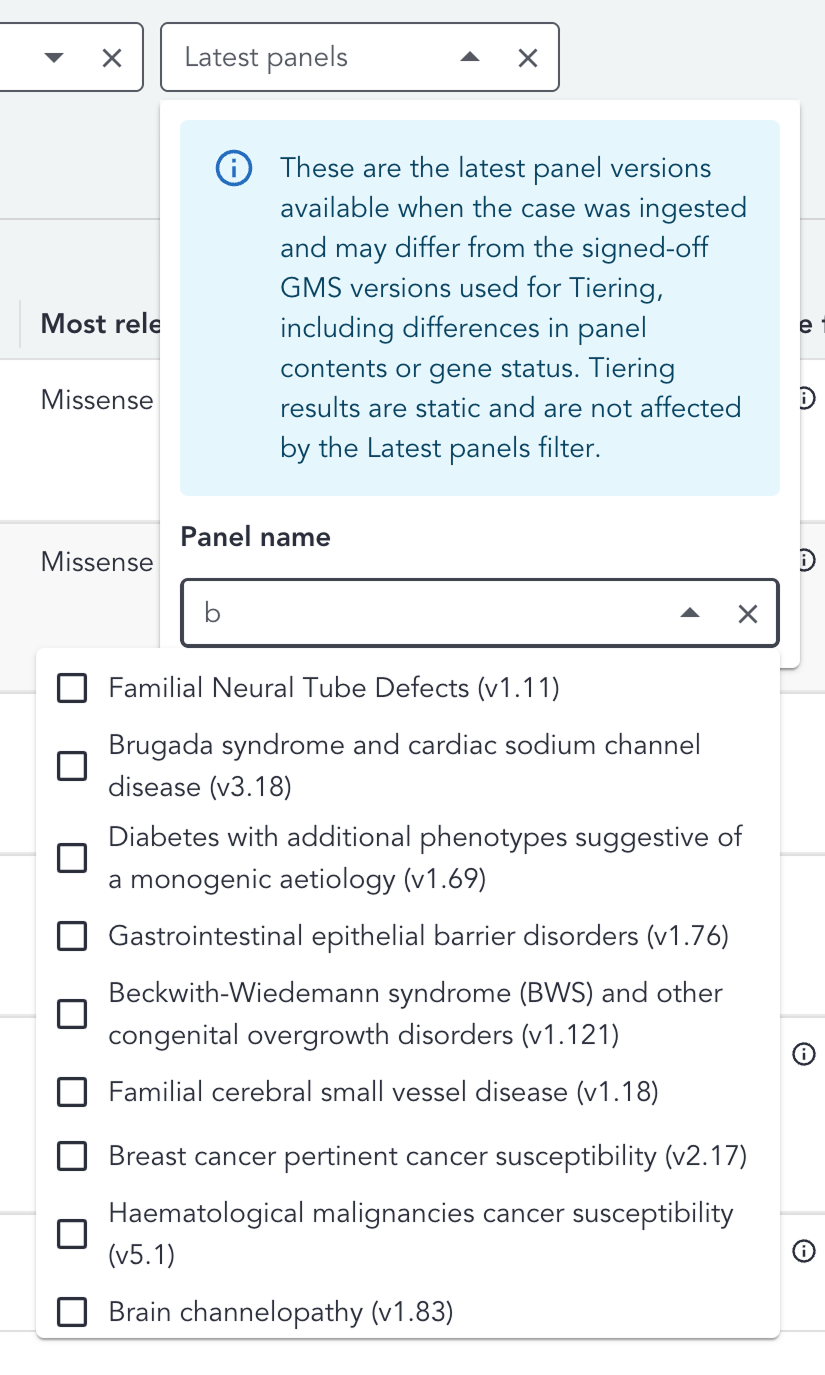
The Latest panels filter allows you to explore variants using the latest PanelApp panel information that was available when the case was annotated.
When a panel is selected, variants are returned where at least one gene associated with the variant is present on the selected panel.
If multiple panels are selected, the filter uses OR logic, so a variant is returned if one of its associated genes is present on any of the selected panels.
Latest panels are separate from the panels used during the original Tiering analysis. They are the latest, non-GMS signed-off panel annotations available when the case was ingested, and may differ from the signed-off GMS panel versions used during the original Tiering analysis, including differences in panel contents or gene status. Tiering results are static and are not affected by the Latest panels filter. Applying this filter does not re-run Tiering or recalculate the Tier values displayed in the grid. This is also highlighted within the filter itself, in the disclaimer text.
Super panels are labelled SP. Hover over the label to see Super panel.
For older cases where Latest PanelApp panels were not annotated, the filter is unavailable and a warning is displayed: Latest PanelApp panels were not annotated for this case.
Genes filter
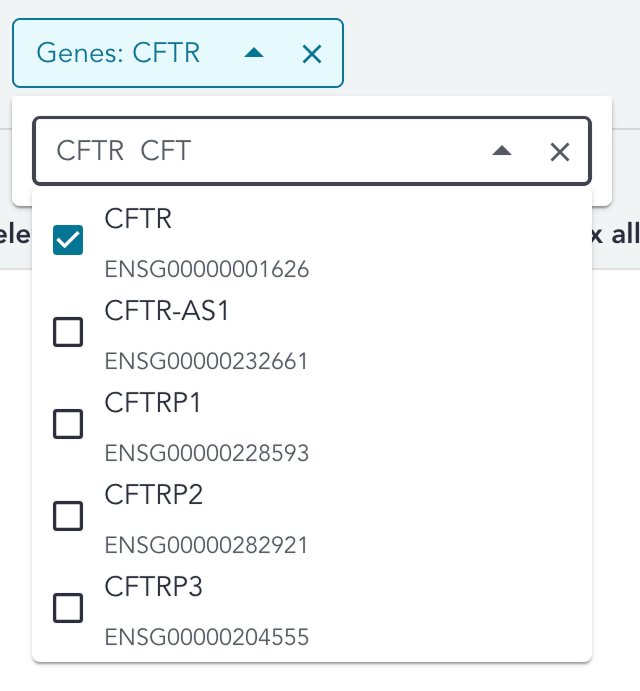
The Genes filter allows variants to be filtered using an HGNC gene symbol or Ensembl gene ID.
The available options are generated from genes annotated against SNVs in the case, rather than from a complete reference list. The options may therefore differ between cases and between the SNV and CNV grids, and a gene will not appear where it has not been annotated against any variant of that type in the case. For genes with many associated identifiers, further options are loaded as the dropdown is scrolled. The filter query uses both the gene symbol and Ensembl ID to ensure that all matching variants are returned.
Begin typing a gene symbol or Ensembl ID to display matching options. Multiple genes can be selected, and variants annotated with any of the selected genes are returned.
The filter includes variants annotated as overlapping the selected gene, including variants located up to 5 kb upstream or downstream of the gene. These variants can be identified by their upstream or downstream consequence annotations.
Only gene symbols and Ensembl IDs annotated at the point the case was ingested can be searched. The filter does not map between previous and current gene symbols or Ensembl IDs. Searching with an alternative, historical or subsequently updated identifier may therefore return no matching option, even where the gene is present under a different identifier.
Several genes may be annotated against a variant. Only genes associated with the variant’s highest Tier are displayed directly in the grid. A gene that caused the variant to match the filter may instead be associated with a lower-tier report event or no report event and may only be visible in the gene overlay or Tiering overlay.
When the Gene filter is combined with a report-event filter, such as Tier, Segregation or Penetrance, each filter is evaluated independently against the variant. For example, a variant overlapping two genes may be Tier 1 in one gene and untiered in the other. Filtering for the untiered gene together with Tier 1 will still return the variant because the gene filter matches any gene overlapped by the variant, while the Tier filter matches the separate Tiering report event. Tiering information and the associated genes should always be reviewed to confirm why the variant matched the filter query.
Tiering is based on the PanelApp version used when the case was processed, whereas gene colours reflect the latest PanelApp annotations available at case ingestion. In the unlikely event that a gene’s PanelApp status changed between Tiering and ingestion, the latest gene colour may not correspond to the original Tiering result.
VCF filter
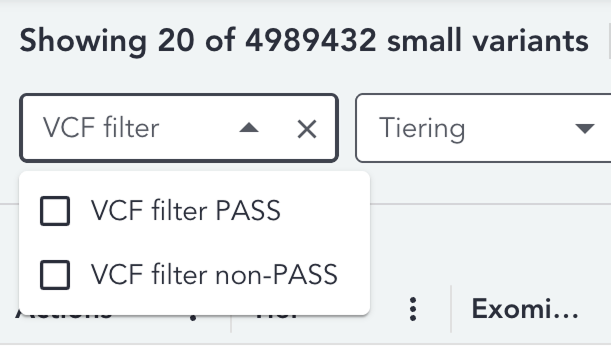
Variants can be filtered based upon whether they passed QC filters applied during the analysis. This is an annotation produced by the Genomics England Rare Disease Pipeline which originates from the VCF file. There are 2 selection options (see below). If both are selected, variants will be displayed that match either selection.
- VCF filter PASS
- VCF filter non-PASS
Filter combinations
Filters can be applied in combinations to further narrow down the number of variants displayed within the grid. For example, if the VCF pass filter was applied at the same time as the Tier filter, the variant would need to meet both criteria to be displayed within the grid in the filter results. There are several notable caveats to this:
Filters can be applied in combination to further narrow down the number of variants displayed within the grid. For example, if the VCF pass filter is applied at the same time as the Tier filter, a variant must meet both criteria to be displayed in the filtered results.
There are several notable behaviours when combining filters, which are laid out in the below table. Tier, Penetrance, Segregation and Tiered panels filters have been referred to as Tiering filters. These filters are based on Tier prioritisation results.
| # | Filter combination | Behaviour |
|---|---|---|
| 1 | Tiering filters | When multiple Tiering filters are applied, all selected criteria must exist within the same Tier prioritisation result for the variant to be returned. |
| 2 | Exomiser + Tiering filters | Exomiser criteria are evaluated against Exomiser prioritisation results (criteria must be met within the same Exomiser prioritisation result), while the selected Tiering filter criteria are evaluated separately against Tier prioritisation results. Where multiple Tiering filters are applied, all selected Tiering criteria must exist within the same Tier prioritisation result. |
| 3 | Genes + Tiering filters | The Genes filter and Tiering filters are evaluated independently against the variant. The variant must overlap the selected gene and separately have a Tier prioritisation result matching the selected Tiering criteria. The selected gene does not need to be the gene associated with that Tier prioritisation result. For example, a variant may be Tier 1 for one gene but returned when filtering for a different overlapping gene. Similarly, when Genes and Tiered panels are combined, the selected gene does not need to be present on the selected Tiered panel. Review the Tiering information and associated gene to confirm why the variant matched. |
| 4 | Genes + Latest panels | Genes and Latest panels are linked at the gene level. For a variant to be returned, it must overlap the selected gene and that gene must be present on the selected Latest panel. This differs from Genes + Tiered panels, where the selected gene does not need to be present on the selected panel. |
Incompatible combinations
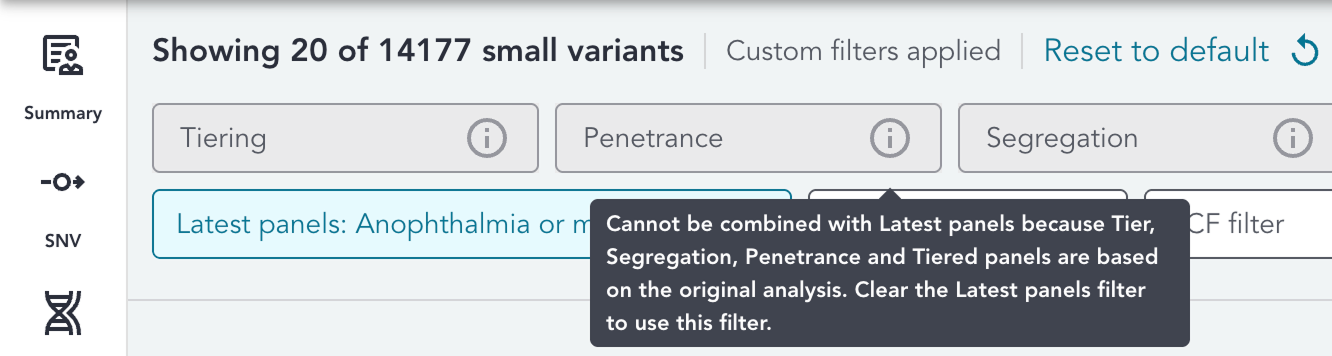
Some filters in the SNV grid cannot be used together because they are based on different analyses or underlying data. When an incompatible filter is applied, the corresponding filters are disabled. Hover over a disabled filter to see why it cannot currently be selected. Clear the incompatible applied filter to make it available again.
Latest panels and Tiering filters
The Latest panels filter cannot be combined with:
- Tier
- Segregation
- Penetrance
- Tiered panels
- Exomiser
Tier, Segregation, Penetrance and Tiered panels are based on the original Tiering analysis. In contrast, Latest panels uses the latest panel versions available when the case was ingested.
These panel versions may differ from those used for the original Tiering analysis. Combining them could therefore give misleading results, as a variant may be associated with a gene on a Latest panel without having been assessed or Tiered using that panel.
Exomiser and panel filters
Exomiser cannot be combined with:
- Latest panels
- Tiered panels
This is because Exomiser and panel filtering use gene information from different data versions. As a result, the genes associated with a variant may not always correspond between the two datasets, so combining these filters could produce unexpected inclusions or exclusions.
Tier
This can be Tier 1, Tier 2, Tier 3, or "-" for untiered variants or variants that do not fall within a gene. When clicking on the tooltip next to the Tier, the Tier overlay opens.
For details on how to sort by Tier, please visit the sorting section.
Tier overlay
The Tier overlay displays details about the Genomics England Tiering outcome for the variant.
The highest Tier assigned to the variant and the clinical indication for the proband are displayed at the top of the overlay.
Below this we see all prioritisation results (previously known as Report Events) for the variant displayed in a table; the gene, panel, and the variant segregation, inheritance and penetrance considered by Tiering as part of the finding are displayed per prioritisation result.
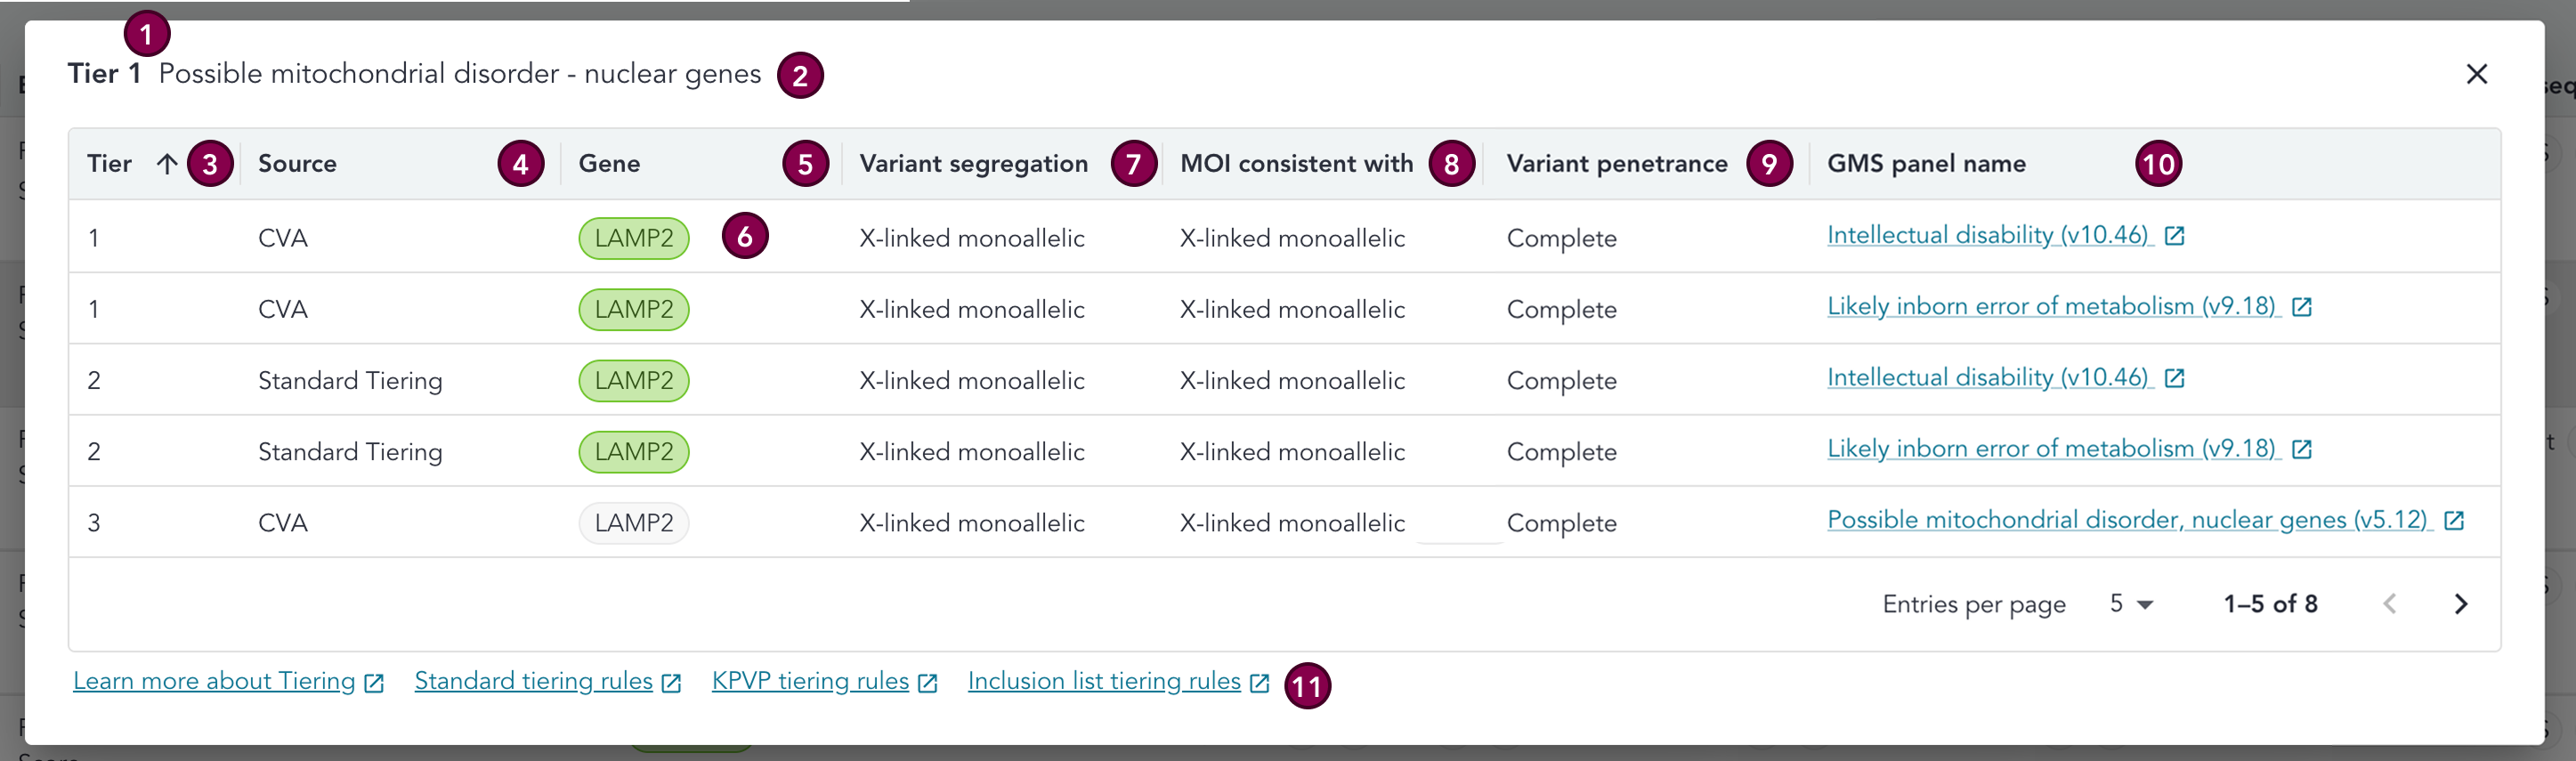
Key
| # | Section | Description |
|---|---|---|
| 1 | Highest Tier | The highest Tier assigned to the variant by Genomics England Rare Disease Tiering. |
| 2 | Clinical indication | The clinical indication for the proband. |
| 3 | Tier | Tier assigned by Genomics England Rare Disease Tiering. These are sorted in order: Tier 1, Tier 2, Tier 3. The chevron in the column header can be used to toggle the sort between ascending and descending. |
| 4 | Source | The source of the Tier assigned to the variant by Genomics England Rare Disease Tiering. This can be either: Standard Tiering, KPVP (ClinVar), KPVP (CVA), Inclusion list. See the Tiering algorithm page in the Rare Disease Genome Analysis Guide for further details. |
| 5 | Gene | Gene for the Genomics England Rare Disease Tiering result. |
| 6 | Gene colour | The gene pill is coloured green when the gene is green in at least one PanelApp panel (/superpanel) of the most recent version at the time of case ingestion, where that panel is also a panel that has been applied to the case. |
| 7 | Variant segregation | The segregation that the variant fits with and that led to this Tiering outcome - it may be any of these terms. |
| 8 | MOI consistent with | The mode of inheritance that the variant fits with and that led to this Tiering outcome - it may be any of these terms. |
| 9 | Variant penetrance | Penetrance mode under which the variant was tiered. For further details, please visit the penetrance modes page in the Genomics England Rare Disease Genome Analysis Guide. |
| 10 | GMS panel name | Name of the GMS panel applied to the patient that is associated with the Genomics England Rare Disease Tiering result, with a link to the GMS signed off PanelApp panel. |
| 11 | Links to GEL Rare Disease Genome Analysis Guide | Links to the relevant pages in the Genomics England Rare Disease Genome Analysis Guide. |
Exomiser
The highest Exomiser rank and corresponding score for the variant are displayed in the Exomiser column (as the variant may have multiple Exomiser ranks and scores due to e.g. consistency with more than one mode of inheritance, or variant overlapping multiple genes). These are determined by the Exomiser pipeline, based on the HPO terms selected for the case. Further details on the Genomics England implementation of Exomiser can be found in the Rare Disease Genome Analysis Guide.
In the case where there is no Exomsier rank or score for a variant (e.g. a variant wasn't considered by Exomiser), a '-' will be visible. Values are displayed up to 4 decimal places.
Clicking the i icon will open the Exomiser overlay, where any further ranks or scores will be visible, along with additional information considered by Exomiser as part of the scoring (e.g. variant MOI and penetrance).
Exomiser overlay
The Exomiser overlay displays all Exomiser ranks and corresponding scores for the variant, in a tabular format. For each row, the drop-down can be clicked to reveal details on the patient phenotypes that were / were not matched to terms in Exomiser's disease models. Please note, the matched terms themselves and their sources are not displayed in this overlay, but are visible in the variant details page.
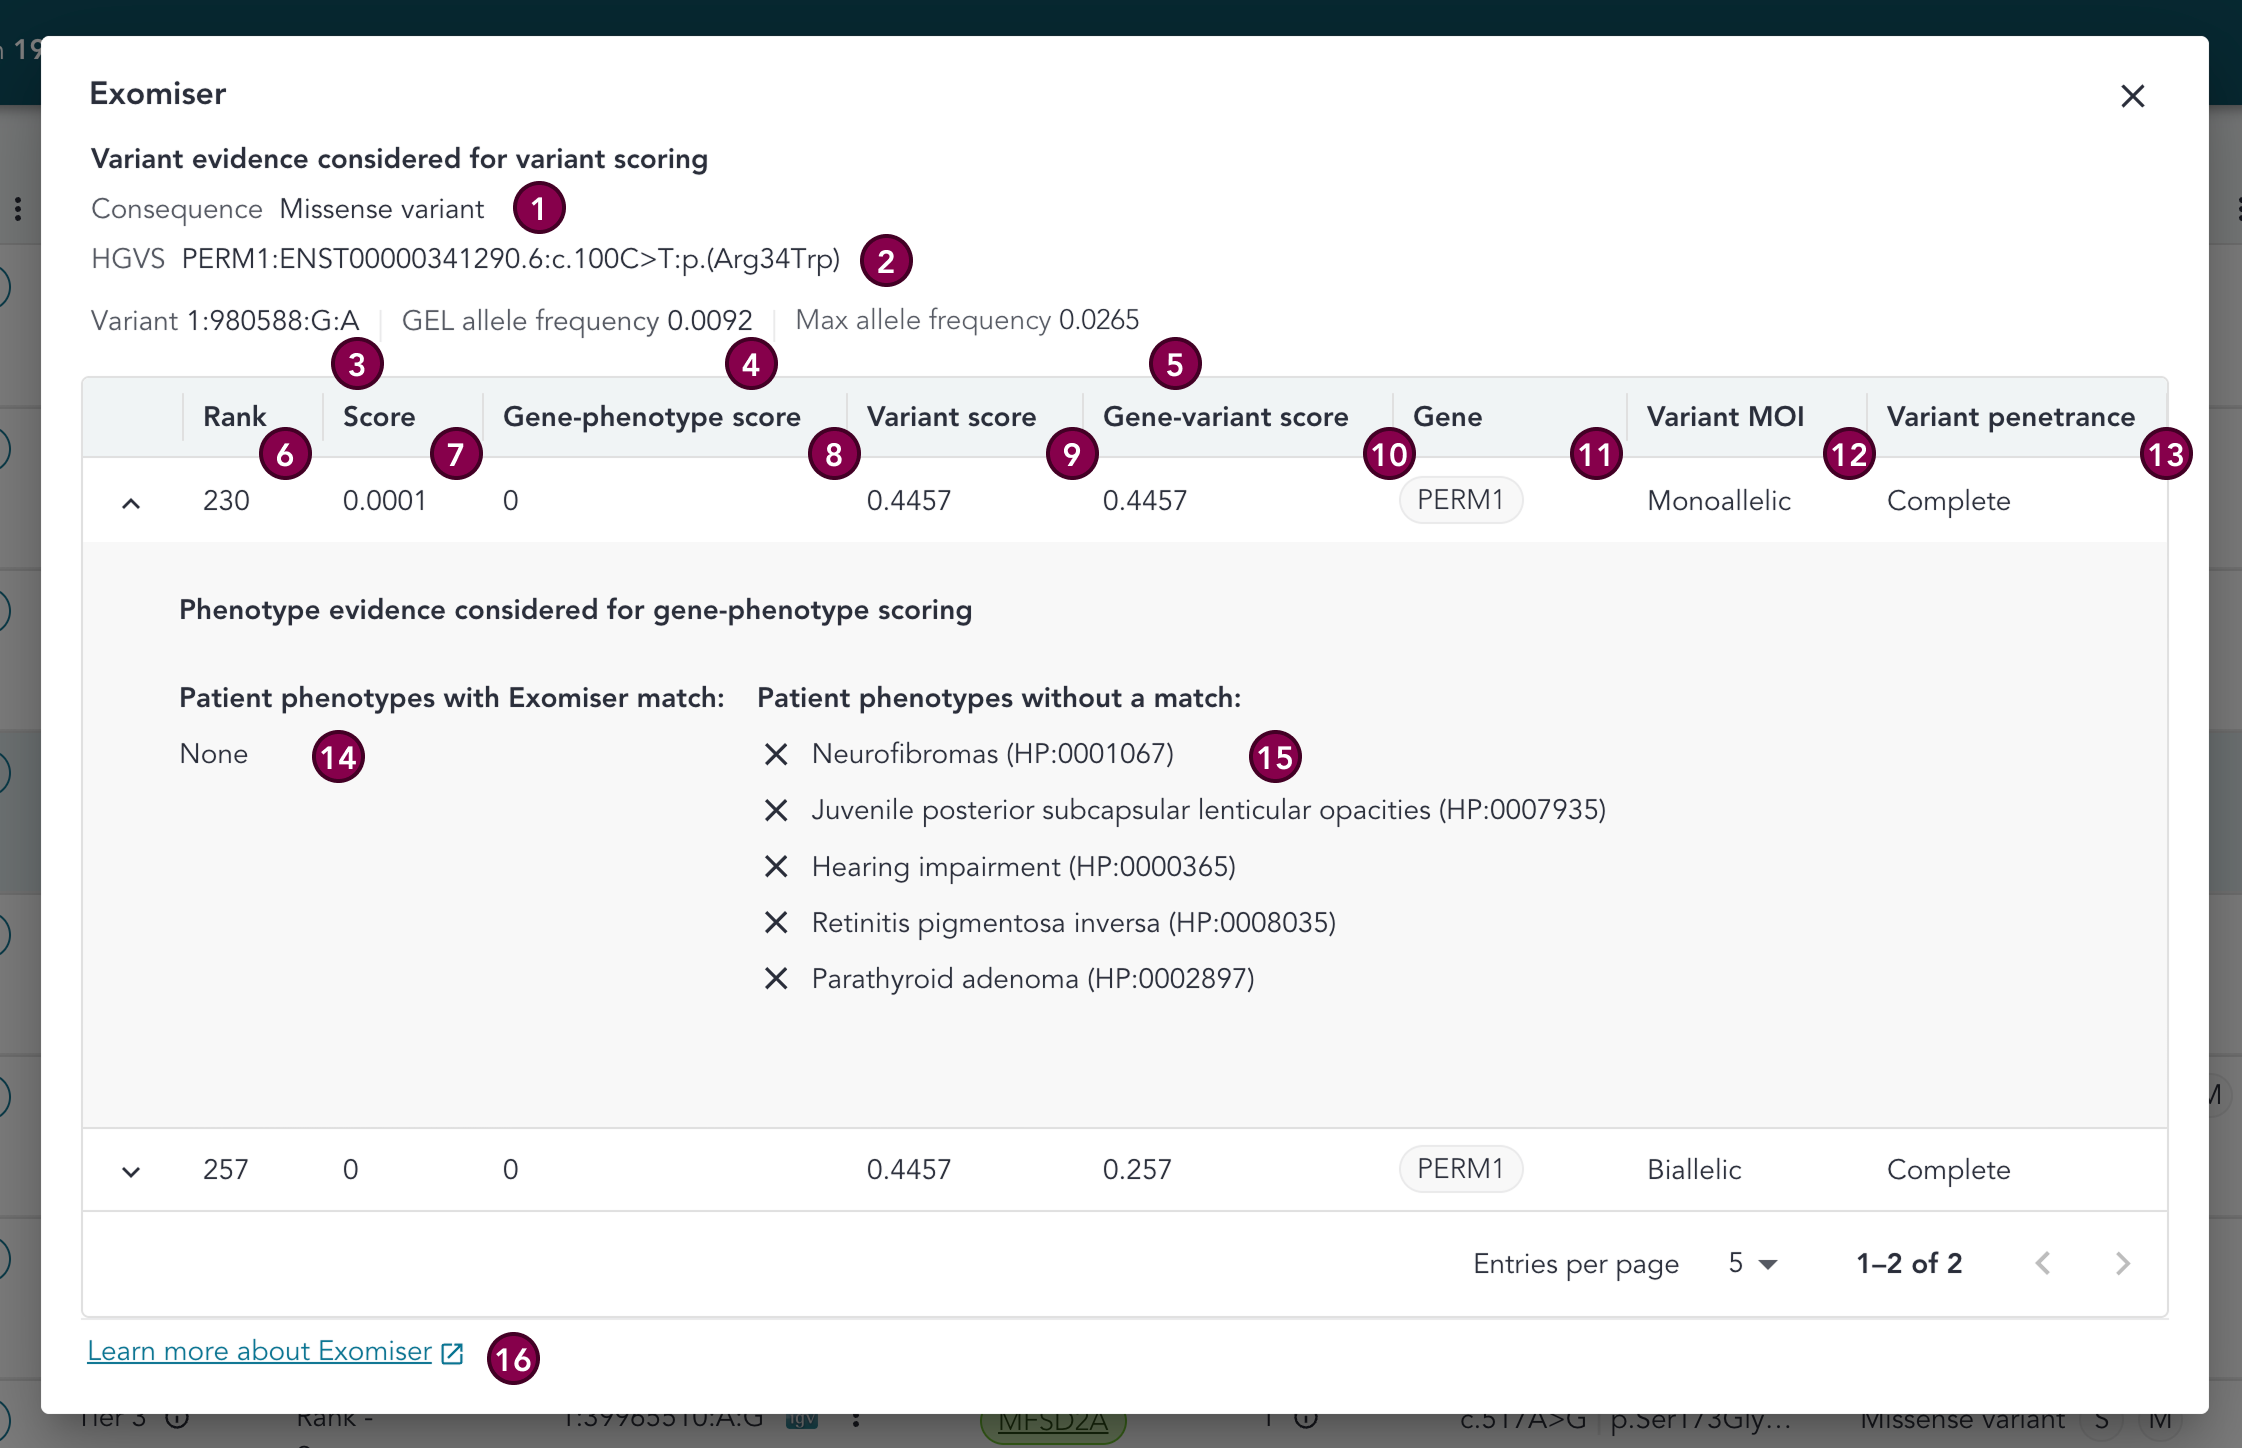
Key
| # | Section | Description |
|---|---|---|
| 1 | Consequence | Variant consequence. |
| 2 | HGVS | Variant HGVS. |
| 3 | Highest rank | Highest Exomiser rank for the variant. |
| 4 | GEL allele frequency | Maximum Genomics England allele frequency for the variant. |
| 5 | Max allele frequency | Maximum allele frequency for the variant, as considered by Exomiser, which includes various AF cohorts. See details here. |
| 6 | Rank | The rank of the variant. This is decided by comparing the maximum Score for each SNV in the case. Rank = 1 represents the most likely causative candidate. |
| 7 | Score | The combined score integrating variant pathogenicity (Variant score), gene-phenotype similarity (Gene-phenotype score), and inheritance model to prioritize likely causal variants. This score is used to determine the Exomiser Rank. For further details on how this is calculated visit the Rare Disease Genome Analysis Guide. |
| 8 | Gene-phenotype score | The similarity score between the patient’s HPO terms and the known phenotypes of the gene/disease (scale of 0-1). This score is determined by comparison (using a semantic similarity algorithm) of the patient's HPO terms to these HPO terms to the HPO terms describing the typical features of diseases caused by the gene which the variant affects. Higher values indicate higher relevance, phenotype-wise. For further details on how this is calculated visit the Rare Disease Genome Analysis Guide. |
| 9 | Variant score | The pathogenicity score of a single variant, based on functional impact, conservation, population frequency, and in silico predictions (on a scale of 0-1). Higher values indicate higher relevance, pathogenicity-wise. This score is combined with Gene-phenotype score to produce the Score used to rank the variants. For further details on how this is calculated visit the Rare Disease Genome Analysis Guide. |
| 10 | Gene variant score | The highest pathogenicity score among all variants in a gene, reflecting the predicted impact of the most damaging variant (this score does not incorporate phenotype). For further details on how this is calculated visit the Rare Disease Genome Analysis Guide. |
| 11 | Gene | Gene(/s) associated with the Exomiser finding. |
| 12 | Variant MOI | Mode of inheritance being considered by Exomiser. |
| 13 | Variant penetrance | Penetrance being considered by Exomiser. |
| 14 | Patient phenotypes | Phenotypes present in the proband. |
| 15 | Matched phenotype by Exomiser | The patient's HPO terms that semantically match known HPO terms for the gene. These matches are used to calculate the Gene-phenotype score, which is combined with the Variant score to produce the overall Score used for ranking. |
| 16 | Link to GEL Rare Disease Genome Analysis Guide | Link to the relevant page in the Genomics England Rare Disease Genome Analysis Guide. |
Genes
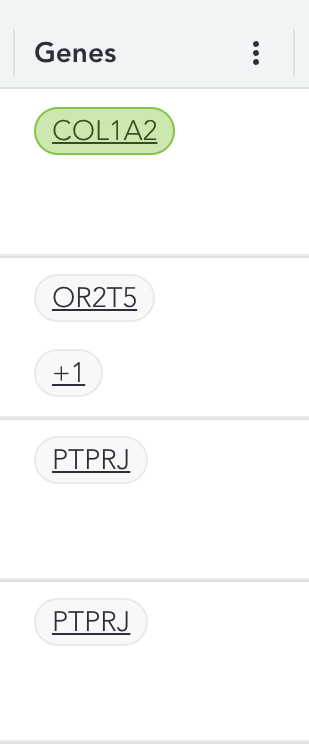
HGNC gene symbol(s) which the variant affects; affected genes in the highest Tier are displayed in the grid. Additional genes at lower Tiers are indicated with a +n icon, with n being the number of genes. This also applies to untiered variants, where all genes will be shown. If there are multiple genes at the highest Tier, these are displayed on separate lines within the row, in no particular order.
Clicking on the gene, or +n in the Genes column opens the gene overlay.
Gene colour
The gene pill is coloured green when the gene is green in at least one PanelApp panel of the most recent version at the time of case ingestion.
The +n pill in the Genes column is also coloured green if this same logic applies to any one(/s) of those lower Tiered genes.
Gene overlay
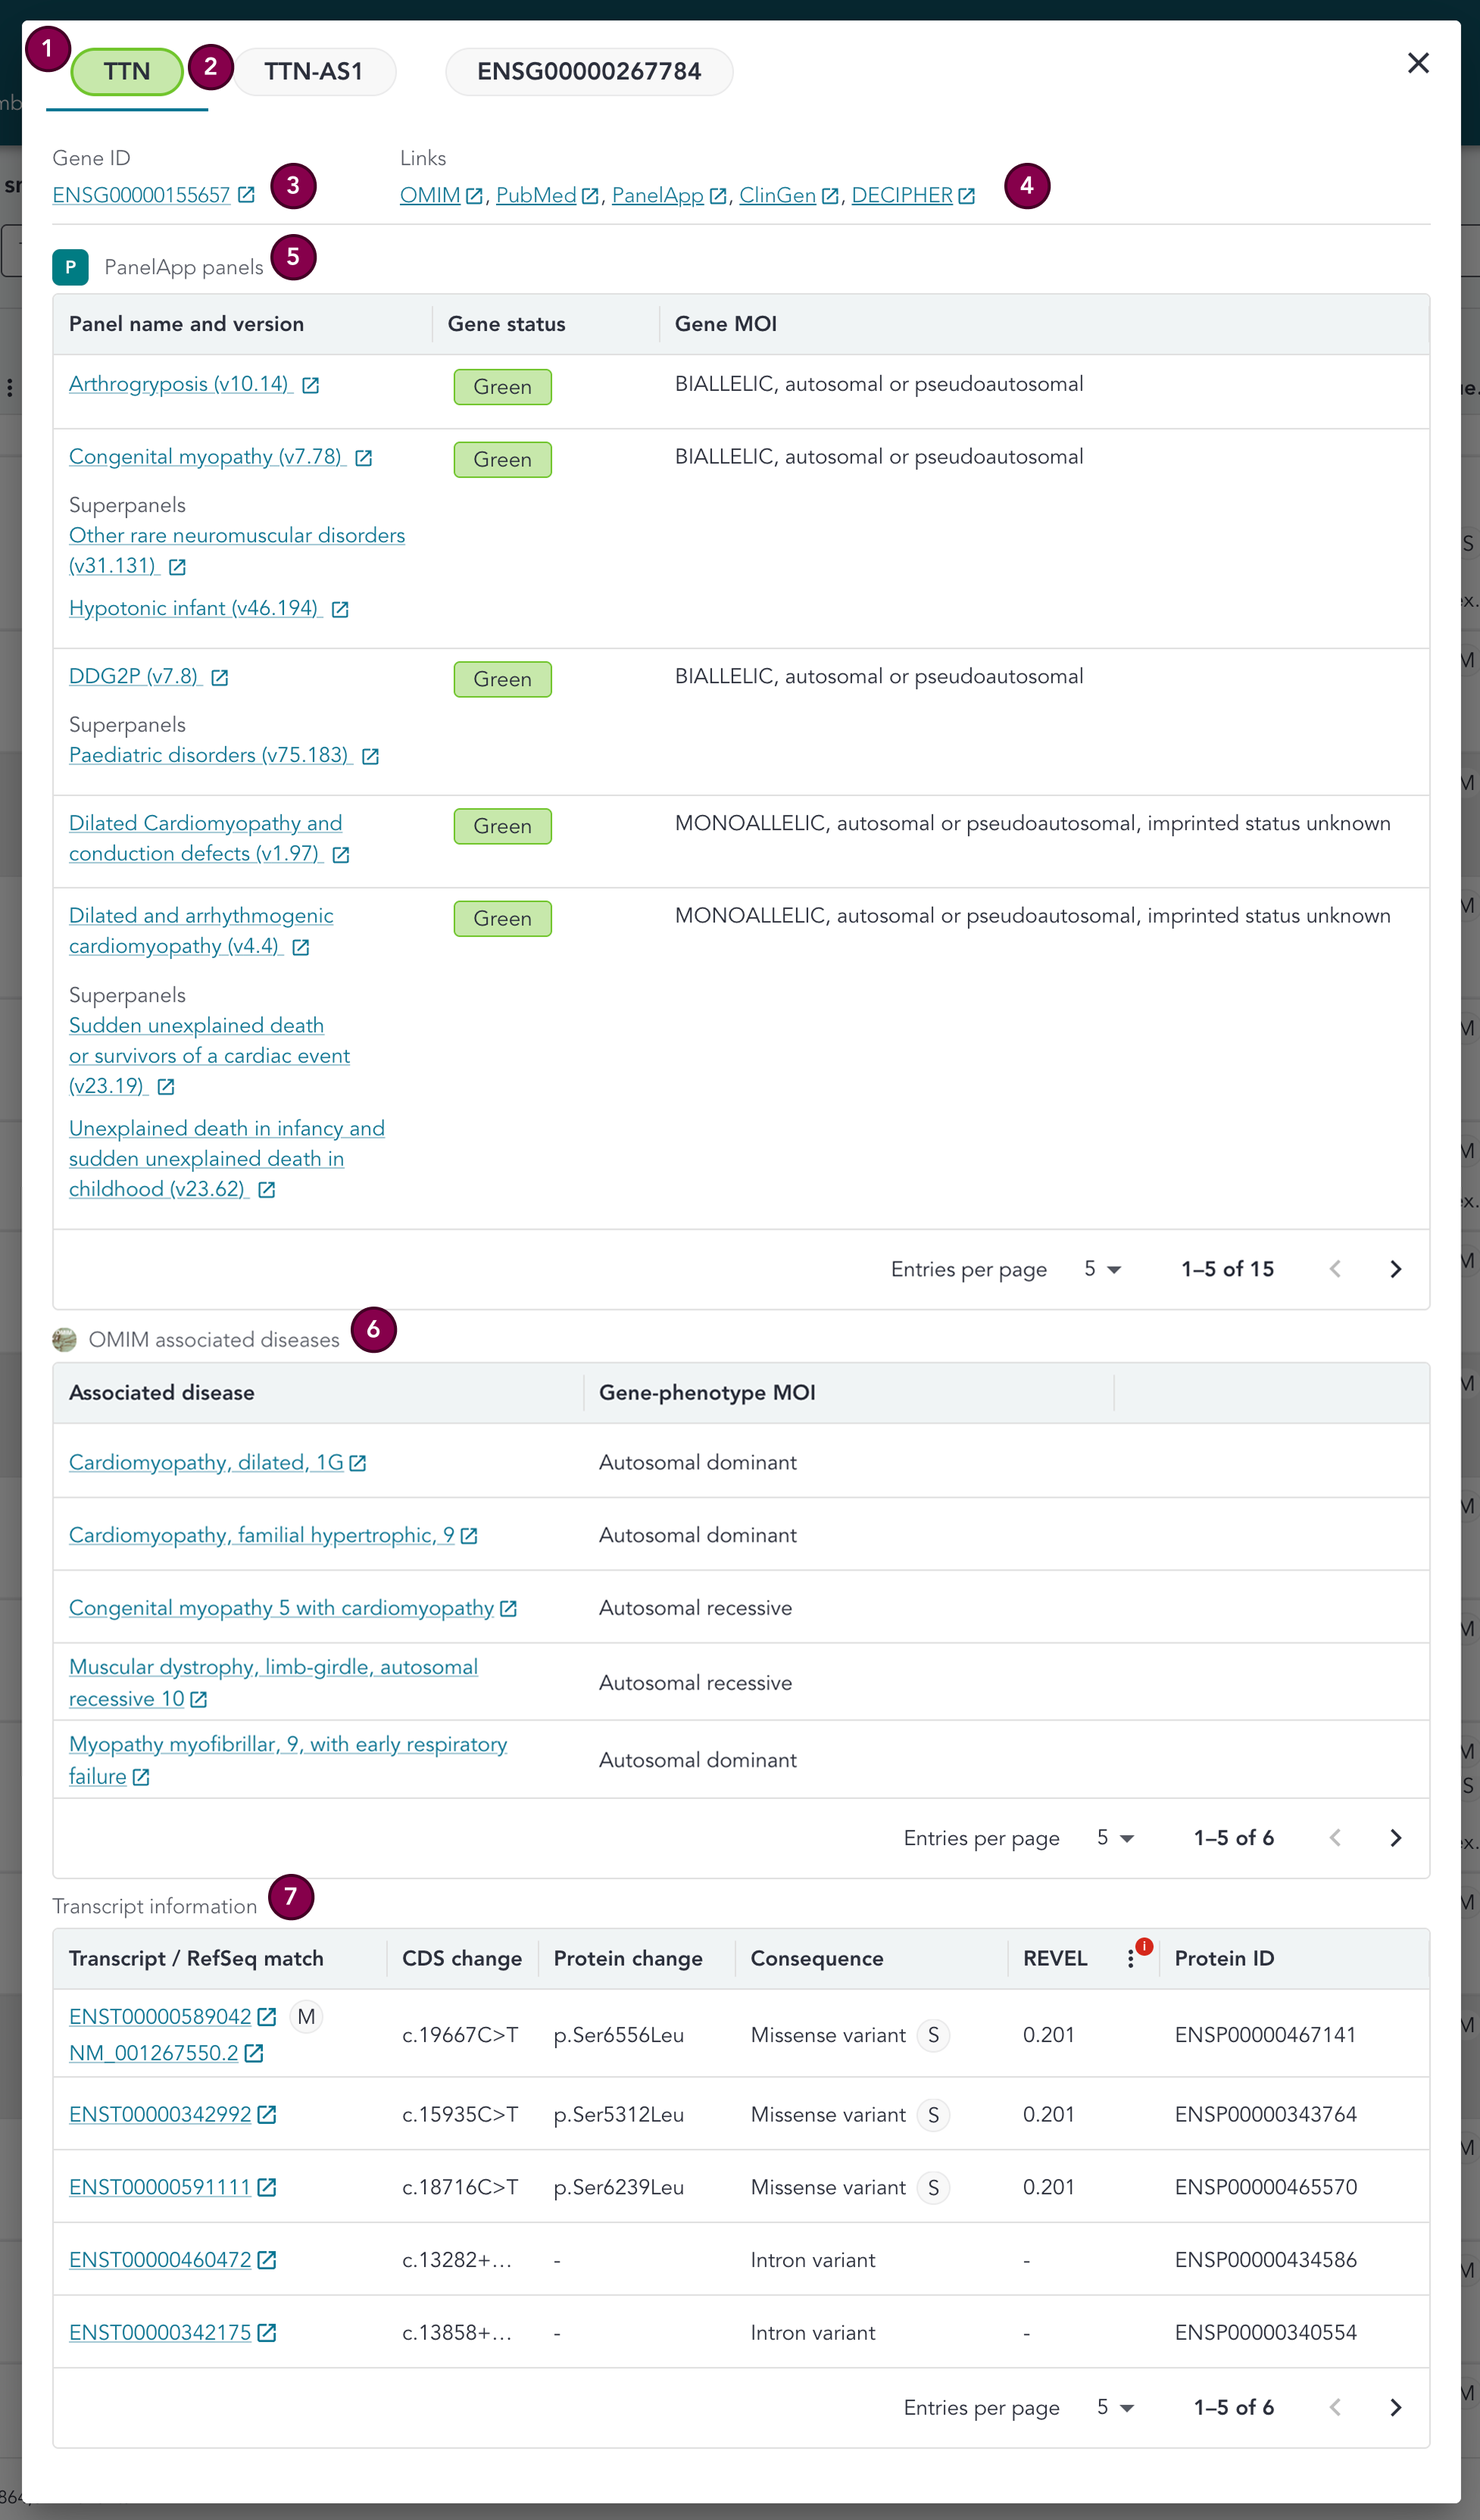
The gene overlay which displays relevant information for the gene.
This includes Ensembl IDs for the gene and transcripts, PanelApp panels (including superpanels) the gene is present in, OMIM associated diseases for the gene, the c. HGVS nomenclature for the CDS change, the p. HGVS nomenclature for the protein change, and links to external resources for the gene (OMIM, PubMed, PanelApp, ClinGen, DECIPHER). All variants are annotated with PanelApp panels and superpanels upon case ingestion, with the underlying dataset used for annotation updated with the most recent PanelApp data every hour (data is static once the case is ingested into the New IB). For further details, see the annotations page.
The gene names can be seen along the top of the overlay; a variant can be associated with more than one gene. Gene names are clickable, with each page displaying the relevant information for that gene.
Key
| # | Section | Description |
|---|---|---|
| 1 | Gene name / header | The gene names can be seen along the top of the overlay; a variant can be associated with more than one gene. These are clickable, with each tab displaying the relevant information for that gene. |
| 2 | Gene colour | The gene pill is coloured green when the gene is green in at least one PanelApp panel of the most recent version at the time of case ingestion. |
| 3 | Gene ID | Ensembl gene ID. |
| 4 | Links | Linkouts to external resources and databases for the gene (OMIM, PubMed, PanelApp, ClinGen, DECIPHER). |
| 5 | PanelApp panels | This section displays the PanelApp panels for the gene (including version and a link-out to the PanelApp page for the panel). If the panel is present in any superpanels, these are listed within the row under a Superpanels header. For each panel (and superpanels), we see the gene rating (green, amber, red), and PanelApp's MOI for the gene. If there is no MOI recorded in PanelApp, then this will be displayed as Unknown. If the gene has been removed from the panel in the most recent version at the time of case ingestion, then a '-' is displayed in the Gene status column, and the Gene MOI will be displayed as Unknown. If the gene is present in no PanelApp panels, then None is displayed in place of all data. |
| 6 | OMIM associated diseases | Displays any diseases associated with the gene in OMIM, as well as the gene-phenotype mode of inheritance, and a link-out to the OMIM page for each disease. Pages of the table can be navigated between using the arrow buttons. |
| 7 | Transcript information | See the Gene information section on the SNV details page for further details on the transcript table. |
OMIM associated diseases
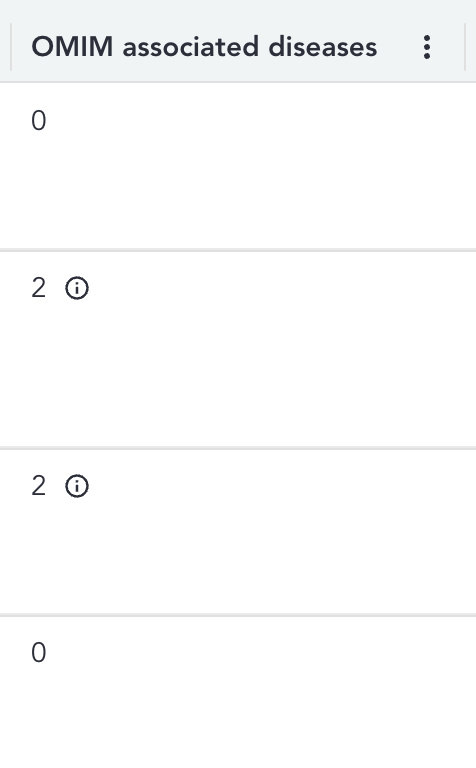
There is a count of associated diseases in OMIM for each gene visible in the row for the variant.
Clicking the i icon opens the OMIM overlay for that specific gene.
OMIM data is annotated at the point of case ingestion, with the underlying data used for annotation being updated with each New IB release. For further details, see the annotations page.
OMIM overlay
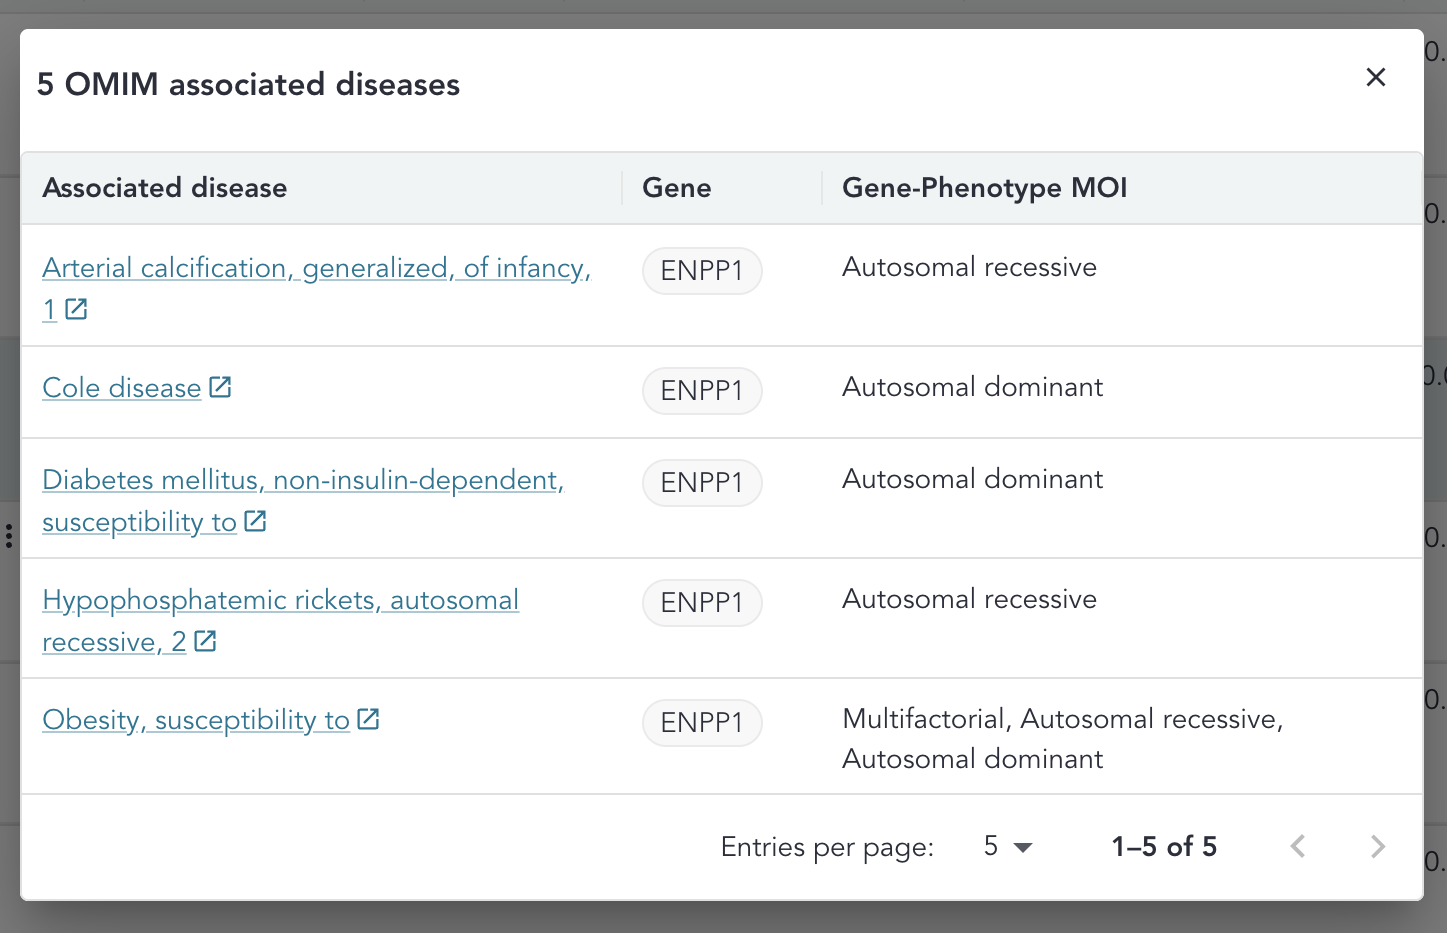
The OMIM overlay displays each disease associated with that specific gene in OMIM, the gene-phenotype mode of inheritance, and a link-out to the OMIM page for each disease. If there is no mode of inheritance in OMIM for an associated disease then Unknown will be visible. The pages of the table can be navigated between using the arrow buttons. The associated diseases are ordered with those associated with a green gene coming first, and then ordered alphabetically by associated disease name.
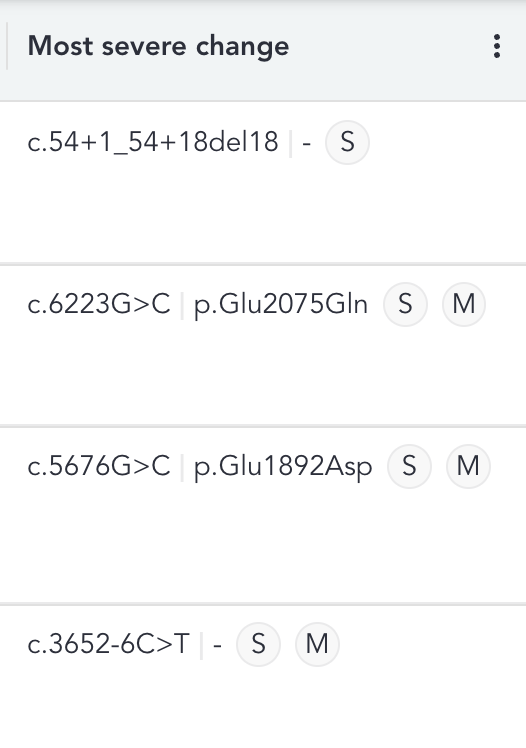
Most severe change
Contains the c. and p. HGVS nomenclature for the transcripts for the gene visible in the row that are any of: - The most severe change across the annotated transcripts for that gene (indicated by the (S) flag) - A MANE Select or MANE Plus Clinical transcript (indicated by (M and/or M+))
If multiple transcripts have the most severe consequence, then the change displayed in the grid is selected based on the following priority order:
- Has the most severe consequence
- Is a MANE Select transcript
- Is a MANE Plus Clinical transcript
- Is the basic transcript (Ensembl GENCODE)
The most severe change is decided by the below priority order:
Consequence priority order
Below is a list of all SO terms annotated by CellBase.
- copy_number_change
- transcript_ablation
- structural_variant
- splice_acceptor_variant
- splice_donor_variant
- stop_gained
- frameshift_variant
- stop_lost
- terminator_codon_variant / start_lost
- initiator_codon_variant
- transcript_amplification
- inframe_insertion
- inframe_deletion
- inframe_variant
- missense_variant
- splice_region_variant
- incomplete_terminal_codon_variant
- stop_retained_variant
- start_retained_variant
- synonymous_variant
- coding_sequence_variant
- mature_miRNA_variant
- 5_prime_UTR_variant
- 3_prime_UTR_variant
- non_coding_transcript_exon_variant
- intron_variant
- NMD_transcript_variant
- non_coding_transcript_variant
- 2KB_upstream_variant
- upstream_gene_variant
- 2KB_downstream_variant
- downstream_gene_variant
- TFBS_ablation
- TFBS_amplification
- TF_binding_site_variant
- regulatory_region_ablation
- regulatory_region_amplification
- regulatory_region_variant
- feature_elongation
- feature_truncation
- feature_variant
- intergenic_variant
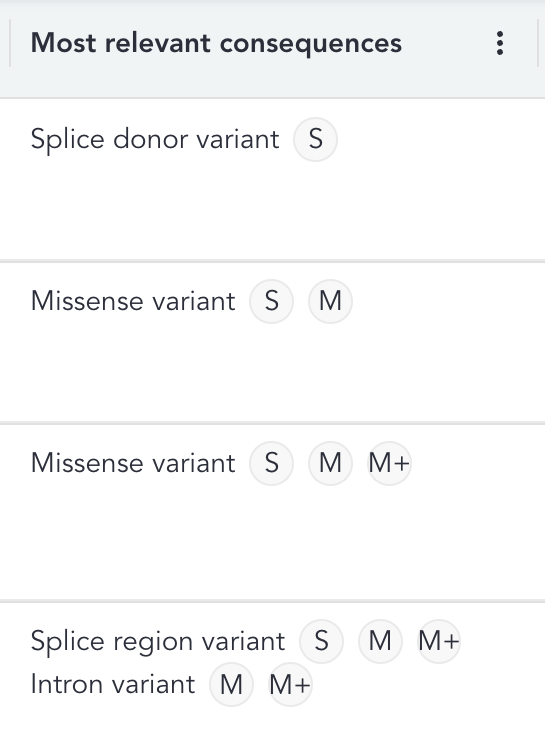
Most relevant consequences
In the grid, we display the predicted consequences (SO terms) for the gene that is visible in the row, that are the most severe across all annotated transcripts for the gene. This is flagged with an S. We also display any consequences for MANE Select (M) and MANE Plus Clinical (M+) transcripts annotated for that gene, when these exist. N.B. multiple consequences can be associated with the same transcript.
Sequence Ontology (SO) terms
Below is a list of all SO terms annotated by CellBase.
- 2KB downstream variant
- 2KB upstream variant
- 3' UTR variant
- 5' UTR variant
- NMD transcript variant
- Coding sequence variant
- Copy number change
- Feature elongation
- Feature truncation
- Feature variant
- Frameshift variant
- Incomplete terminal codon variant
- In-frame deletion
- In-frame insertion
- In-frame variant
- Initiator codon variant
- Intergenic variant
- Intron variant
- Mature miRNA variant
- Non-coding transcript exon variant
- Non-coding transcript variant
- Regulatory region ablation
- Regulatory region amplification
- Splice acceptor variant
- Splice donor variant
- Splice region variant
- Start lost
- Start retained variant
- Stop gained
- Stop lost
- Stop retained variant
- Structural variant
- Synonymous variant
- TF binding site variant
- TFBS ablation
- TFBS amplification
- Terminator codon variant
- Transcript ablation
- Transcript amplification
- Missense variant
- Downstream gene variant
- Upstream gene variant
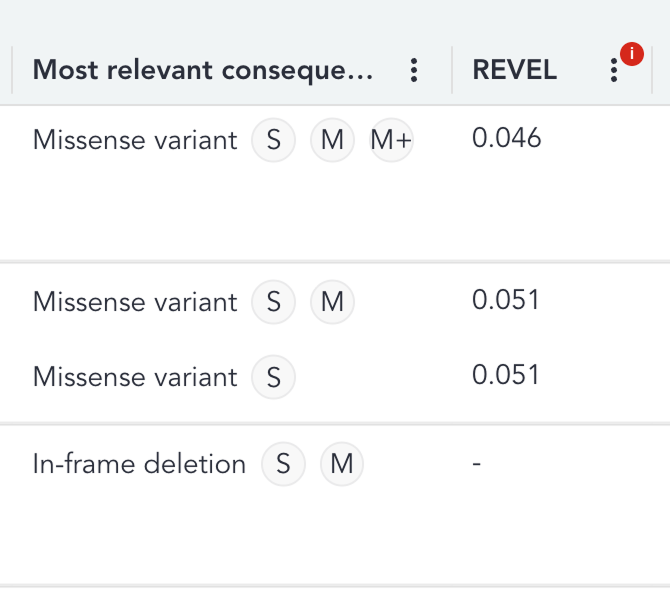
REVEL score
REVEL (Rare Exome Variant Ensemble Learner) is an in-silico prediction score used to estimate the likelihood that a missense variant is disease-causing. Scores range from 0 to 1, with higher scores indicating a greater predicted likelihood that the variant is pathogenic.
REVEL scores can provide computational evidence to support the application of the ACMG/AMP criteria PP3 or BP4. They should be considered alongside other available clinical and scientific evidence.
For each gene displayed in the SNV grid, the system evaluates each consequence shown in the Most relevant consequences column. Where a displayed consequence is a missense consequence, the system identifies all transcripts for that gene with the same consequence and an available REVEL score, and displays the highest score found.
A dash (-) is displayed where the consequence is not missense or where no transcript with the matching missense consequence has an available REVEL score. This logic is applied independently to each gene displayed for the variant.
Transcript-level REVEL scores are also available in the transcript tables within the gene overlay and SNV details page. This allows individual scores to be reviewed alongside the corresponding transcript, consequence, and coding or protein change. In the transcript tables, a dash is shown where the transcript does not have a missense consequence or where no REVEL score is available for that transcript.
Before applying ACMG criteria, review the transcript tables to confirm which transcript and coding or protein change the REVEL score relates to.
REVEL scores were calculated for missense variants using GENCODE v19 transcripts on the hg19 assembly and subsequently lifted over to GRCh38. Scores are matched to each transcript using the variant and amino acid change, rather than the transcript identifier.
Because REVEL scores were calculated using legacy transcript models, scores may be unavailable where changes to the genome assembly, transcript structure, or amino acid annotation have created differences from the original REVEL source data.
REVEL is made available under the Open Database License (ODbL).
The REVEL dataset version used to annotate the case is shown in the Software and dataset versions table. For older cases that were not annotated with REVEL data, a warning is displayed in the grid, transcript tables, and dataset-version information.
N.B. REVEL is a computational prediction tool and should not be used as standalone evidence of pathogenicity or benignity.
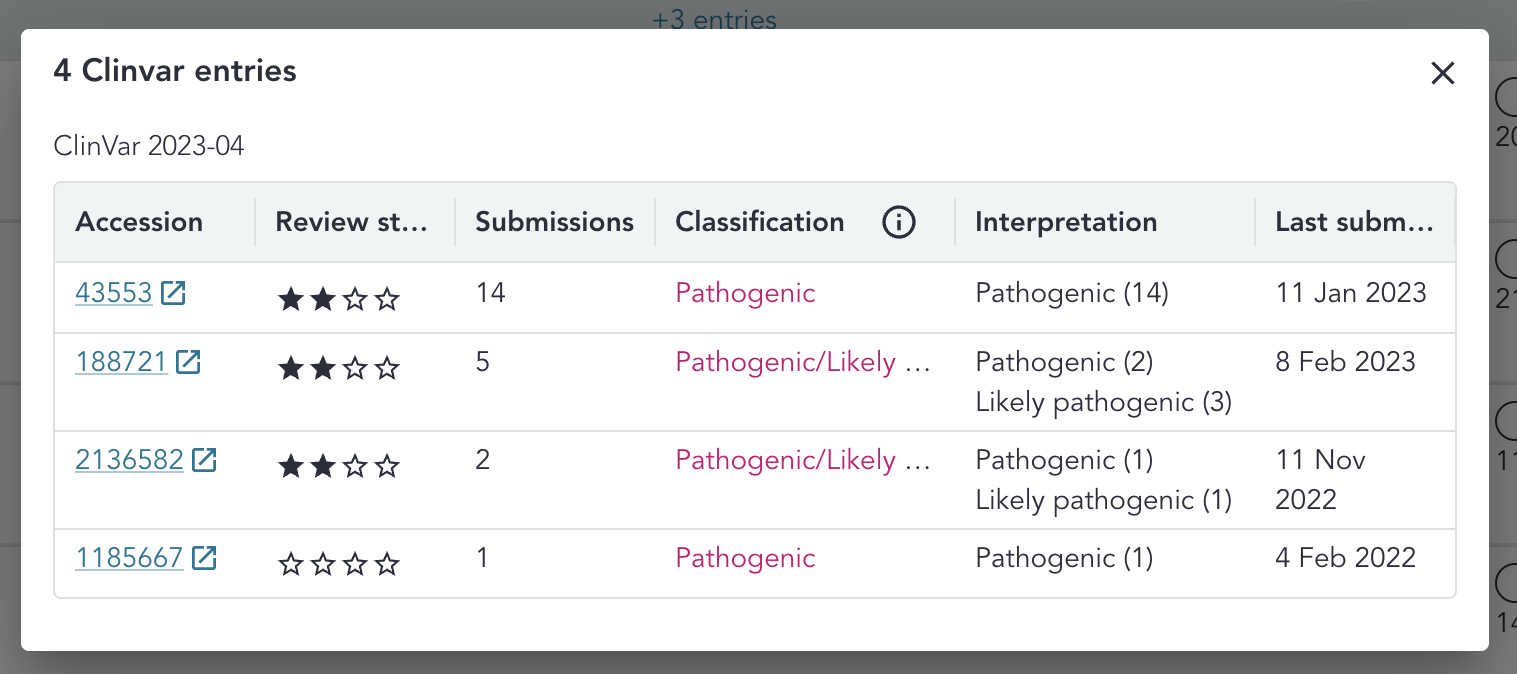
ClinVar overlay
Clicking on the +X entries indicator when there is more than one ClinVar accession number for a variant will open the ClinVar overlay, displaying more detailed information for each accession number. Visit the Other databases section in the variant details page for further details on this table.
ClinVar records are matched to variants using both their genomic representation and their predicted protein consequences (HGVSp) across relevant transcripts, including MANE and non-MANE transcripts. For each variant, all associated HGVSp consequences are calculated and used alongside the genomic representation to identify relevant ClinVar records. This means that a ClinVar record may be associated with a patient variant either because it is an exact genomic match, or because it has the same predicted protein consequence on the same transcript. As a result, multiple distinct genomic variants can sometimes be linked to the same ClinVar record where they produce an equivalent HGVSp consequence. This is particularly relevant for consequences such as initiation codon variants, where different genomic changes may share a representation such as p.Met1?. Therefore, ClinVar annotations displayed in the New IB should not always be interpreted as indicating exact genomic equivalence. In some cases, they reflect a shared predicted protein-level consequence on the same transcript.
De novo (DQ score)
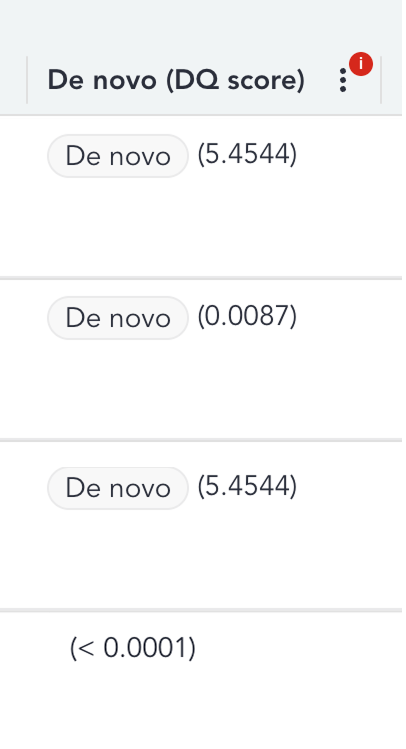
The DQ score column displays the de novo quality score calculated by the rare disease bioinformatics pipeline for each eligible SNV or indel. DQ scores are posterior probability scores based on the possible genotypes within the family and indicate the level of confidence that a variant is a genuine de novo variant.
Higher DQ scores indicate greater confidence in the de novo call, while lower scores may indicate that the apparent de novo variant is more likely to be a false positive. The pipeline uses the following recommended thresholds when assigning a De novo label:
- SNVs: ≥0.0013
- Indels: ≥0.02
For further details, see the de novo variant detection page in the Rare Disease Genome Analysis Guide.
The column displays all available DQ scores, including scores below these thresholds. Therefore, a variant may have a DQ score displayed without being labelled as de novo. For variants with de novo segregation, the applicable pipeline threshold is shown when hovering over the de novo label.
DQ scores are only calculated where sufficient family data are available, such as for trios or larger family structures containing the relevant parental samples. They are not available for singleton cases. Scores may also be unavailable for cases ingested before DQ annotations were introduced, or for individual variants where no score was recorded. In these cases a warning symbol will be displayed in place of the scores, with an explanation displayed on hover.
DQ scores are displayed to four decimal places. Values below 0.0001, including values recorded as zero, are displayed as <0.0001.
N.B. DQ scores indicate confidence in the evidence supporting a de novo call and should be considered alongside the variant’s segregation information and other clinical evidence.
Abbreviations
| Abbreviation | Definition |
|---|---|
| ACGS | Association for Clinical Genomic Science |
| ACMG | American College of Medical Genetics and Genomics |
| CDS | Coding DNA Sequence |
| CIP-API | Genomics England Clinical Interpretation API |
| CNV | Copy Number Variant |
| CVA | Clinical Variant Ark |
| EQ | Exit Questionnaire |
| New IB | New Interpretation Browser |
| GEL | Genomics England |
| GMS | Genomic Medicine Service |
| GLH | Genomic Laboratory Hub |
| HGVS | Human Genome Variation Society |
| HTML | Hyper Text Markup Language |
| HSCN | Health and Social Care Network (N3) |
| IGV | Integrative Genomics Viewer |
| IB | Interpretation Browser |
| IP | Interpretation Portal |
| NGIS | National Genomics Informatics System |
| PID | Patient Identifiable Data |
| QC | Quality Control |
| SoF | Summary of Findings |
| SO | Sequence Ontology |
| SNV | Single Nucleotide Variant |
| SV | Structural Variant |
| TOMS | Test Order Management System |
| UAT | User Acceptance Testing |
| VCF | Variant Call Format File |
| VILs | Variant Interpretation Logs |
| WGS | Whole Genome Sequencing |